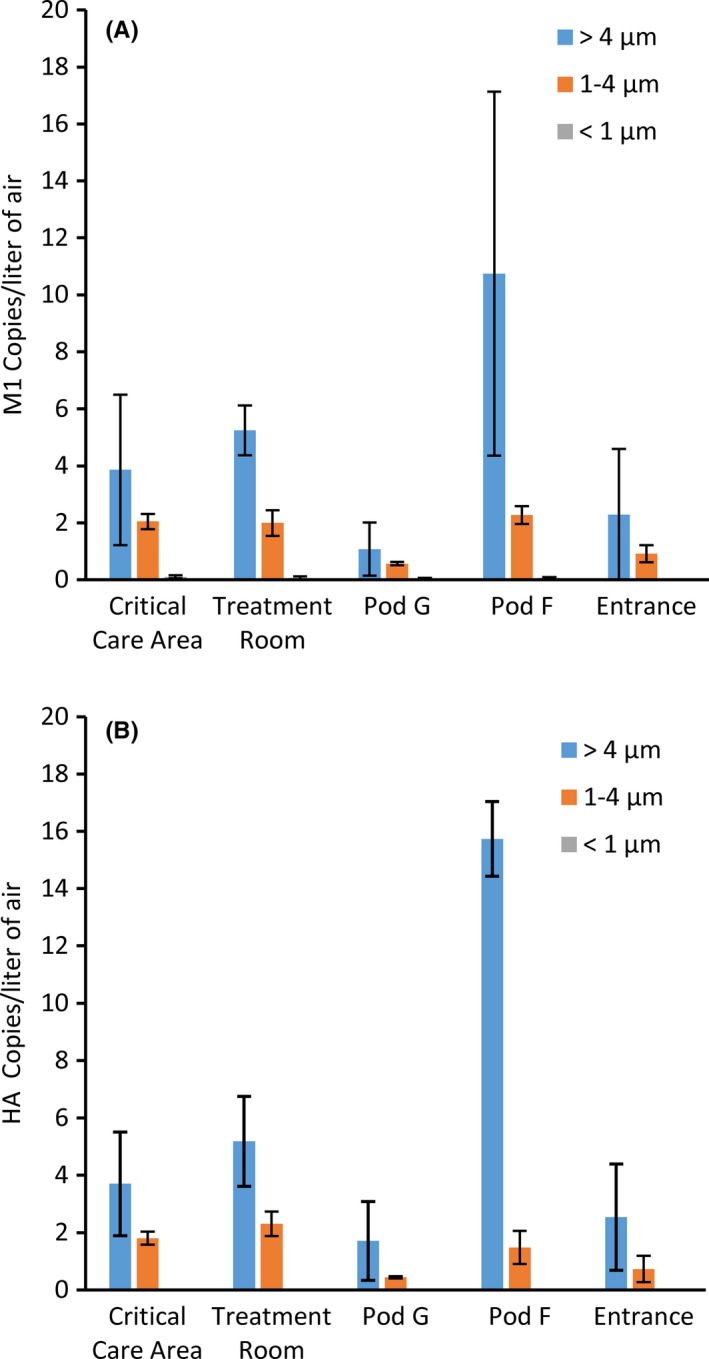
Figure 2.

Aerodynamic size distribution of particles containing H7N2 in the hot zone. The size distribution of (A) M1 and (B) HA gene copies in aerosol samples collected with the NIOSH 2‐stage sampler. Sixteen NIOSH samplers were positioned throughout the hot zone of the first floor quarantine facility. The samplers were mounted in pairs on a tripod and each sampler collected air for 260‐307 min. Critical care area (samplers N01‐06), treatment room (N07, N08), Pod G (N09, N10), Pod F (N11, N12), entrance (N13‐16). The average M1 and HA gene copies/L of air (±standard deviation) collected in each aerosol fraction are shown
