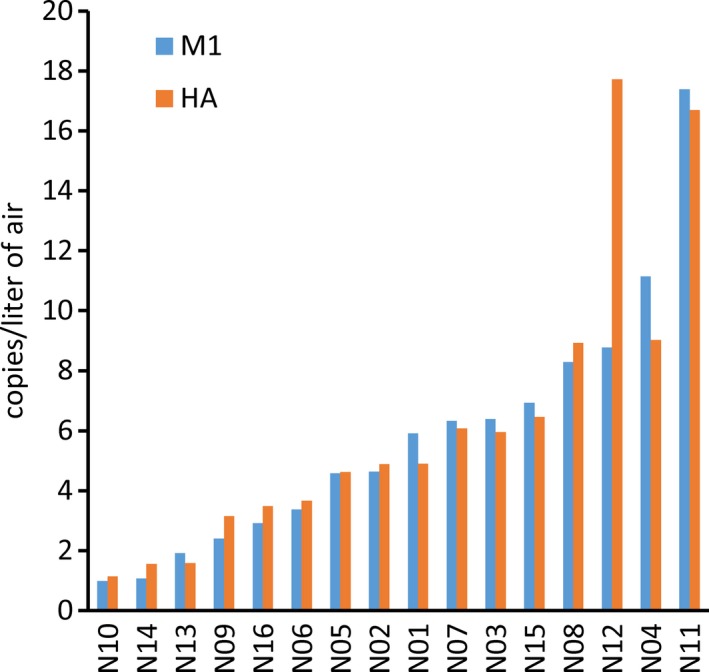
Figure 3.

Total H7N2 virus collected by NIOSH two‐stage samplers in the hot zone of the quarantine facility. The average M1 and HA gene copies/L of air collected from all 3 aerosol fractions (>4 μm, 1‐4 μm, and <1 μm) by the 16 samplers (N01‐16) positioned in the first floor of the quarantine facility are shown
