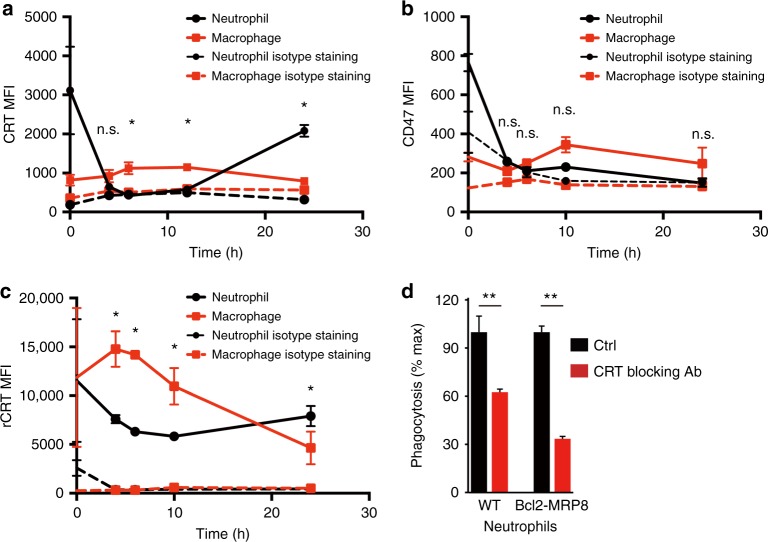
Fig. 2.
Cell surface CRT determines programmed cell removal of neutrophils in peritonitis. a, b Cell surface levels of CRT on macrophages and neutrophils after thioglycollate injection to MRP8-Bcl2 mice. Peritoneal cells were collected and analyzed at 0, 4, 6, 12, and 24 h after thioglycollate injection, by flow cytometry analysis. Results are representatives of three independent experiments. n = 3 mice for each time points. *P < 0.05 (paired t-test) for CRT staining between macrophages and neutrophils at the same time points. Error bars represent standard deviation. b Cell surface levels of CD47 on macrophages and neutrophils after thioglycollate injection to MRP8-Bcl2 mice. Peritoneal cells were collected and analyzed at 0, 4, 6, 10, and 24 h after thioglycollate injection, by flow cytometry analysis. Results are representatives of three independent experiments. n = 3 mice for each time point. n.s. (paired t-test) so significant differences for CD47 staining between macrophages and neutrophils at the same time points. Error bars represent standard deviation. c Binding of recombinant CRT to macrophages and neutrophils after thioglycollate injection to MRP8-Bcl2 mice. Peritoneal cells were collected and analyzed at 0, 4, 6, 10, and 24 h after thioglycollate injection. CRT-binding sites on macrophages and neutrophils were measured by incubating the cells with saturation concentration of recombinant CRT and analyzing by flow cytometry. Results are representatives of three independent experiments. n = 3 mice for each time point. *P < 0.05 (paired t-test) for rCRT staining between macrophages and neutrophils at the same time points. Error bars represent standard deviation. d An in vitro phagocytosis assay showing blockade of CRT inhibits phagocytosis of neutrophils, with WT and Bcl2 neutrophils as target cells and peritoneal macrophages. Neutrophils were collected 4 h after thioglycollate treatment and cultured for 24 h. Phagocytosis was normalized to the maximal response in the experiments. n = 3. **P < 0.01 (t-test) for phagocytosis between ctrl and CRT blocking Ab treatment. Error bars represent standard deviation. In a, b, and c, MFI, mean fluorescence intensity

