Fig. 4.
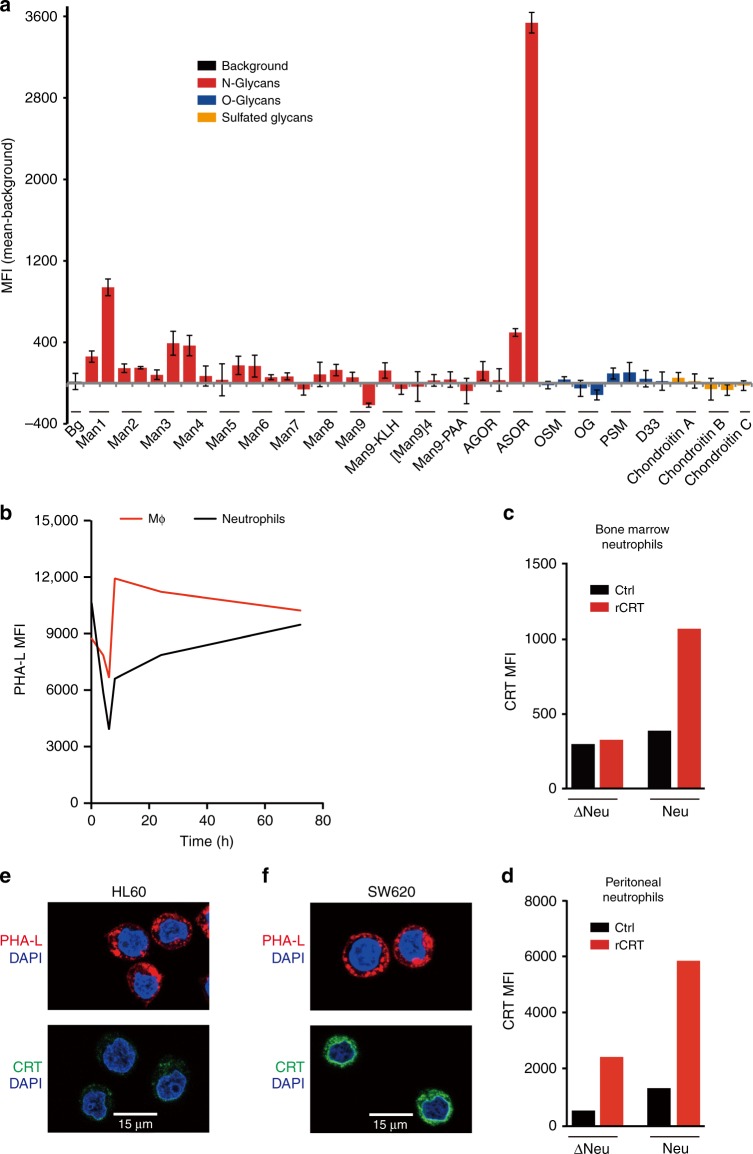
Identification of CRT-binding ligands on aged and malignant cells. a Screening for CRT-binding glycans with carbohydrate microarray. Purified CRT-IgG-Fc proteins were used to probe a carbohydrate microarray containing a number of different types of glycans, including N-, O- and sulfated-glycans. Anti-IgG-Fc antibody was used for detecting binding of CRT to glycans. Glyco-antigens were used at 0.05 and 0.25 μg μl−1 (left and right bars for each glycan). n = 3. Error bars represent standard deviation. b PHA-L binding to peritoneal neutrophils and macrophages at 0, 4, 6, 8, 24, and 72 h after thioglycollate injection in MRP8-Bcl2 mice. c, d Examination of cell surface CRT-binding sites on neutrophils. Bone marrow (c) or peritoneal neutrophils (d) were collected and treated with heat inactivated neuraminidase (Δneu) or neuraminidase (neu). Cells were incubated with PBS (control; black) or recombinant CRT proteins (red) and binding of CRT was then measured by flow cytometry with PE-conjugated anti-CRT antibody. rCRT binds to mature peritoneal neutrophils but not the immature bone marrow neutrophils. Treatment with neuraminidase led to the release of CRT-binding sites. e, f Immunofluorescent staining of CRT in HL60 (e) and SW620 (f) cells. CRT localized to perinuclear regions, vesicles, and cell surface. CRT was either expressed at a low level (e) or limited to the perinuclear regions (f), while a significant portion of PHA-L staining were observed on the cell surface (e and f).In a–d, MFI, mean fluorescence intensity

