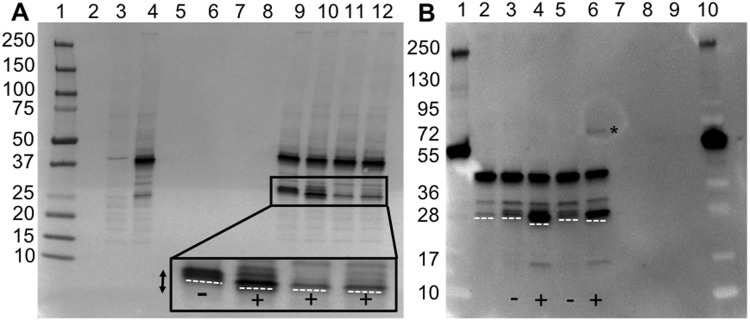
Figure 5.
Transfer of biotin to hCNTF upon PTS. (A) Comparison of peptide 1 and peptides 5–7 (biotin-conjugated peptides). Lanes: (1) molecular weight marker; (2) Laemmli buffer; (3) HeLa lysate without DNA (negative control); (4) HeLa CFPS expressed hCNTF-NpuDnaEΔC16; (5) Peptide 1; (6–8) Peptide 5–7; (9–12): hCNTF-NpuDnaEΔC16 protein trans splicing with peptides 1, 5, 6, and 7 respectively. Inset: magnification of the hCNTF (−) and hCNTF-biotin bands (+). (B) Lanes: (1&10) molecular weight marker; (2) HeLa CFPS expressed hCNTF-NpuDnaEΔC16 (total protein); (3) HeLa CFPS expressed hCNTF-NpuDnaEΔC16 with peptide 1 (protein trans splicing reaction); (4) HeLa CFPS expressed hCNTF-NpuDnaEΔC16 with peptide 5 (protein trans splicing reaction); (5) HeLa CFPS expressed hCNTF-NpuDnaEΔC16 with peptide 1 (protein trans splicing reaction) and streptavidin; (6) HeLa CFPS expressed hCNTF-NpuDnaEΔC16 with peptide 5 (protein trans splicing reaction) and streptavidin; (7–9) Laemmli buffer; (*) Streptavidin bound to biotinylated hCNTF. The white dashed lines indicate the front of the bands. Uncropped images can be seen in Fig. S9.

