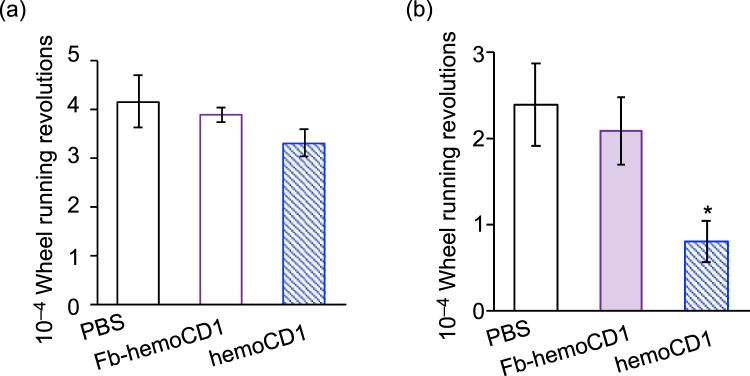
Figure 4.
Cumulative wheel running revolutions in the first (a) and second 24 h periods (b) after i.p. administration of PBS, Fb-hemoCD1, and hemoCD1. Each bar represents the mean ± SE (n = 3 mice per group). The mice were housed for two weeks under a 12 h light/dark (LD) cycle (lights on at 7:00 and light off at 19:00) until the day before the experiments. The mice were then housed under constant dark (DD) conditions during the observations. Asterisk denotes statistical significance (*P < 0.05), as compared to the controls. The raw actograms for measuring the wheel running activity are shown in Fig. S4.

