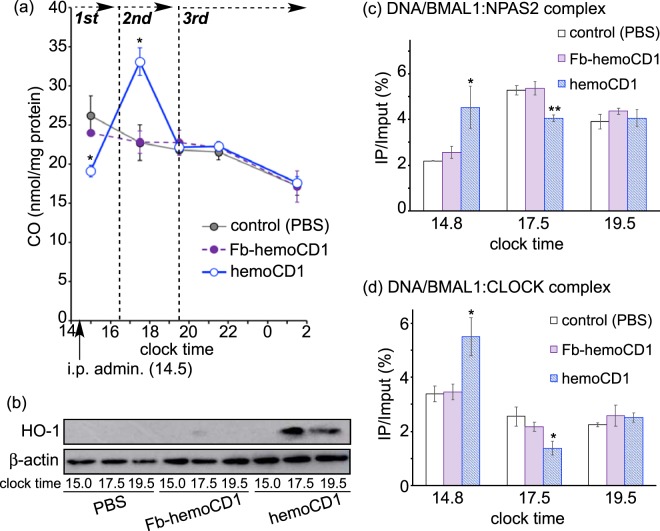
Figure 5.
Quantification of CO, HO-1, and the DNA/protein complexes in the liver of the hemoCD1-treated mice. The mice were housed for two weeks under a 12 h light/dark (LD) cycle (lights on at 7:00 and light off at 19:00) until the day before the experiments. The mice were then housed under constant dark (DD) conditions during the observations. (a) Endogenous CO levels were measured by the assay using hemoCD135. (b) HO-1 levels were ascertained by western blotting with an anti-HO-1 antibody at clock time 15.0 (first phase), 17.5 (second phase), and 19.5 (third phase). (c,d) ChIP assays were conducted using anti-NPAS2 and anti-CLOCK antibodies to measure the corresponding DNA complexes at clock time 14.8 (first phase), 17.5 (second phase), and 19.5 (third phase). PBS and Fb-hemoCD1 were used as controls. Each bar represents the mean ± SE (n = 3 mice per group). Asterisk denotes statistical significance (*P < 0.05, **P < 0.01), as compared to the controls.

