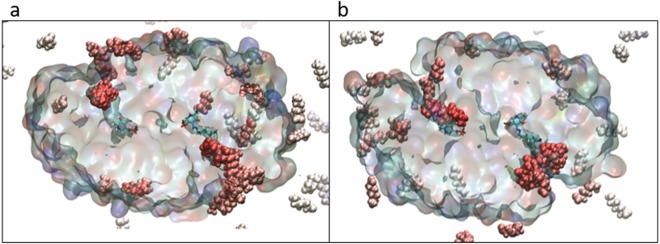
Figure 3.
A representation of the in silico substrate competition assays. Overlay of frames for the substrates taken over 25 ns. Cross sections of the dimeric KES23360 (panel a) and N43 (panel b) proteins are shown as a surface, with cofactors in unbound and bound forms (PLP and the HMD:PLP aldimine complex, respectively) shown in a single conformation and in stick representation. AHA molecules are shown as spheres and coloured using a blue/white/red colour scale, relative to their proximity to the centre of the protein. The AHA molecules clearly localise in the active site of the protein in proximity to the cofactors.

