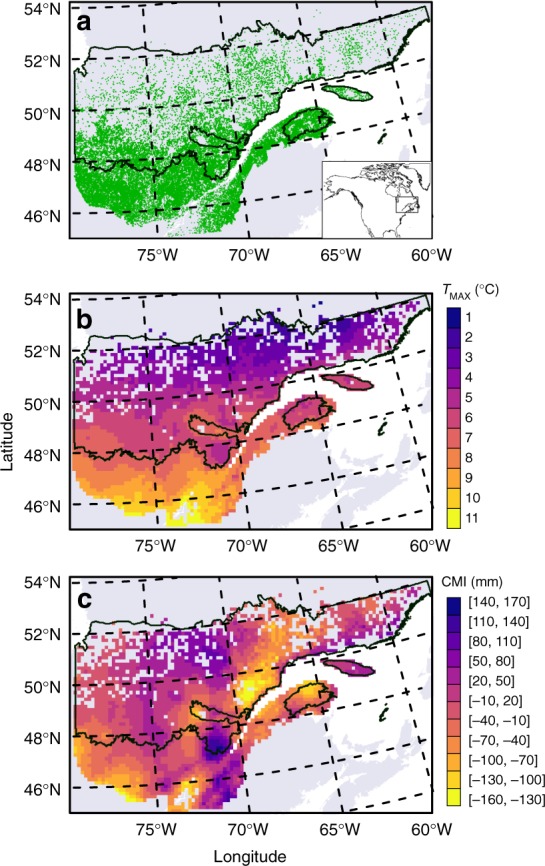
Fig. 1.

Plot location and average climate of the study area. a Location of sampled plots (green) in Quebec, Canada (gray). b Average annual daily maximum temperature (TMAX) across sampled plots. c Growing season (May to September) climate moisture index (CMI, see Methods). The intermediate black line indicates the limit between the boreal and temperate vegetation zones while the upper black line represents the limit for commercial forestry. Variables in b, c are averaged over the study period (1985–2005) and per 15-km polygon. Data for base maps from https://www12.statcan.gc.ca/census-recensement/2011/geo/bound-limit/bound-limit-2011-eng.cfm with permission under http://open.canada.ca/en/open-government-licence-Canada and from https://www.donneesquebec.ca/recherche/fr/dataset/systeme-hierarchique-de-classification-ecologique-du-territoire used with permission under a Creative Commons 4.0—Attribution CC BY
