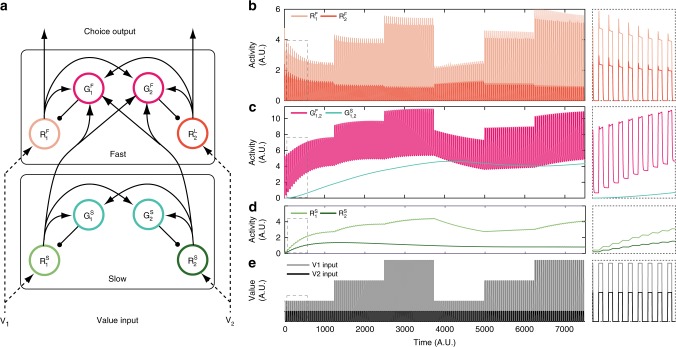
Fig. 1.
Cascaded normalization model and example model behavior. a Cascaded dynamic normalization model. Circuits are arranged into separate slow (bottom) and fast (top) subcircuits. Model units are either excitatory (R) or inhibitory (G); arrows depict excitatory and dots inhibitory connections. b–e The network behavior using a simple input structure emulating consecutive trials over time (e); panels on the right show an expanded view of a small time interval (dashed boxes). b Dynamic activity of the fast circuit excitatory units. These units show fast transients and subsequent sustained responses to value input in single trials. c Dynamic activity of fast (pink) and slow (teal) circuit inhibitory units. Note that, in the model architecture, inhibitory neurons within a subcircuit (fast or slow) act as a single pool and are plotted together. d Dynamic activity of slow circuit excitatory units. Over trials, slower adaptation-like effects within the slow circuit are propagated to the fast subcircuit. Contrasting the first and second half of the stimulation demonstrates the profound differences in value coding elicited by the temporal context despite having the exact same input structure (b). e Simulated value inputs. In this simulation, V2 was kept constant while V1 was changed across blocks; values were turned on during each trial and set to zero between trials

