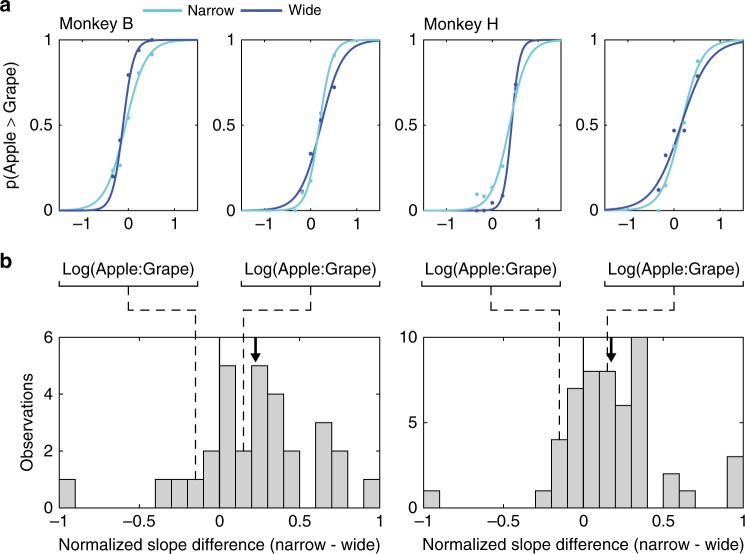
Fig. 3.
Individual choice data and aggregate behavioral performance. a Example single session monkey choice curves. Each choice curve is fit to data from single session test choice data from narrow (light blue line) and wide (dark blue line) blocks; dots show session average choice data. Data from two sessions in each animal are shown. Example sessions consistent with (right panel in each pair: narrow slope > wide slope) and contrary to the efficient coding prediction (left panel in each pair: narrow slope < wide slope) are displayed. b Normalized slope difference (narrow−wide) of all sessions performed by each animal. Left, Monkey B (n = 30 sessions); right, Monkey H (n = 39 sessions). A significant mean shift toward positive slope differences (narrow > wide) can be observed (arrow, mean slope difference)

