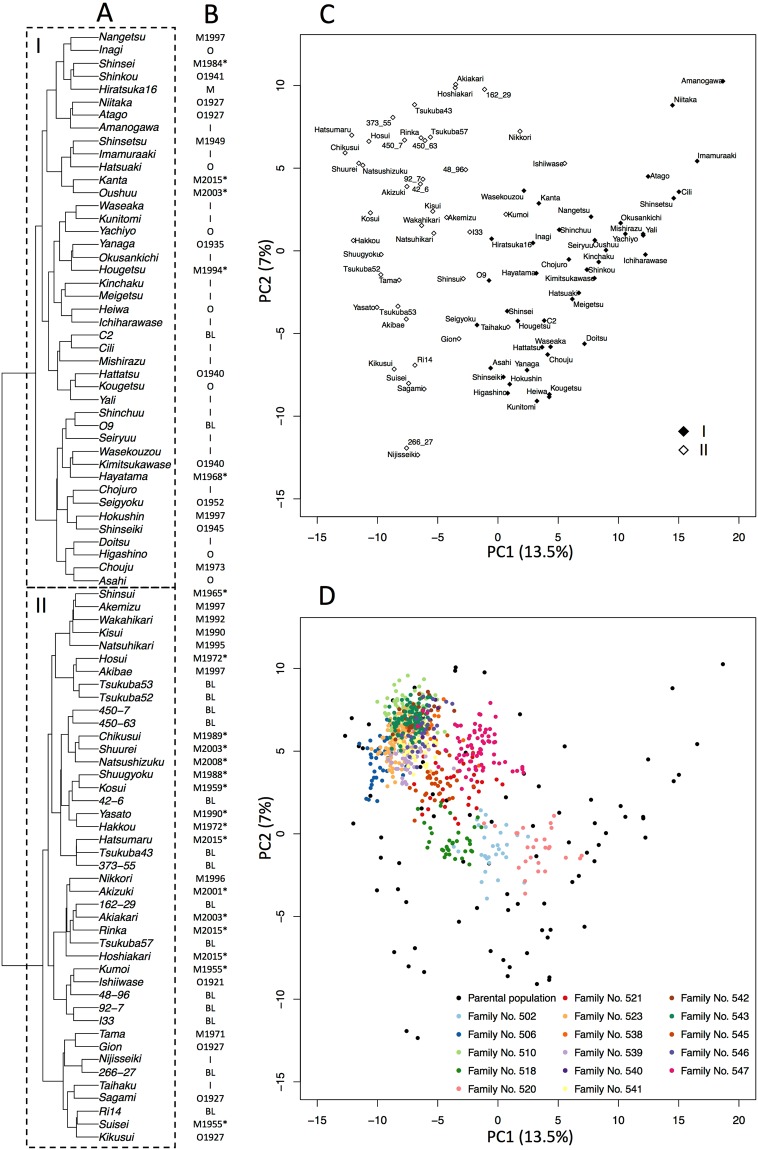
Figure 2.
Structures of parental and combined populations. (A) Hierarchical clustering of the parental population. (B) Types of varieties (I, indigenous; O, old; M, modern; BL, breeding line) and release years (Supplementary Table S1). Asterisks indicate modern elite cultivars bred by the NARO Institute of Fruit Tree Science. (C) PCA of the parental population. Black and white diamonds indicate clusters I and II estimated by hierarchical clustering, respectively. (D) PCA of the combined population. Black circles indicate the parental population. Coloured circles indicate members of each family of the breeding population (see Supplementary Table S2).

