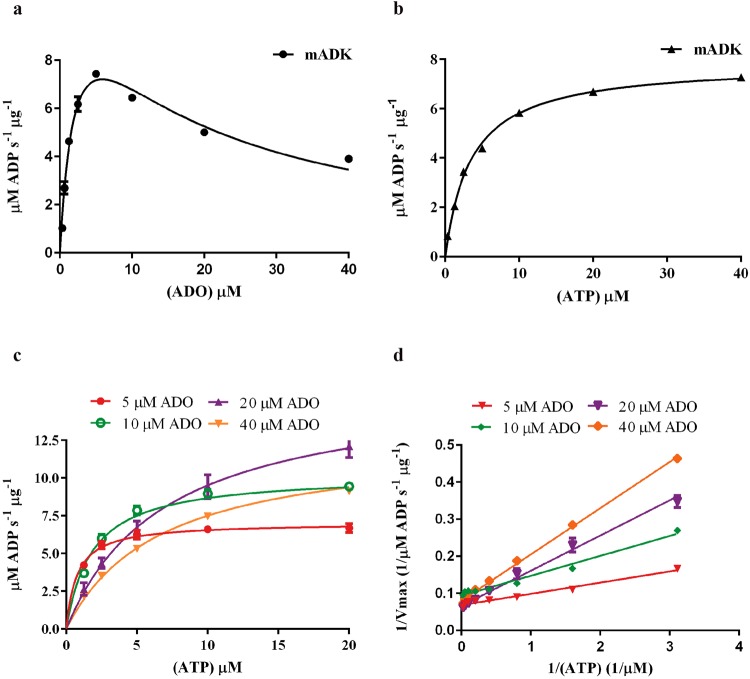
Figure 2.
Determination of mADK kinetic parameters and substrate inhibition study. The mADK kinase activity was monitored through resorufin fluorescence which is directly related to the amount of ADP converted to the ADHP (10-acetyl-3,7- dihydroxyphenoxazine) dye precursor. The signals were measured at 530 nm (excitation) and 590 nm (emission) wavelengths. (a) Apparent Km curve for ADO, employing 15 mM mADK, 20 µM ATP and ADO from 0 to 40 µM. ADO concentrations above 5 μM inhibited the mADK. (b) Km curve for ATP, employing 15 mM mADK, 10 µM ADO and ATP from 0 to 40 µM. mADK presented characteristic Michaelis Menten Kinetic for the ATP substrate. Constants for ADO and ATP are shown in Supplementary Table 1. (c) Substrate competition studies evaluated by ATP Km curves over a range of ADO concentrations (5, 10, 20 and 40 µM). Stepwise increases of ADO reduce the affinity of mADK to ATP, as indicated by the parallel increases of the Km (Supplementary Table 2). (d) The mechanism of ADO inhibition was assessed by double reciprocal Lineweaver-Burk plots of 1/v versus 1/[ATP] µM data, which revealed that ADO is a competitive inhibitor of ATP. Reactions were carried out at 303 K.

