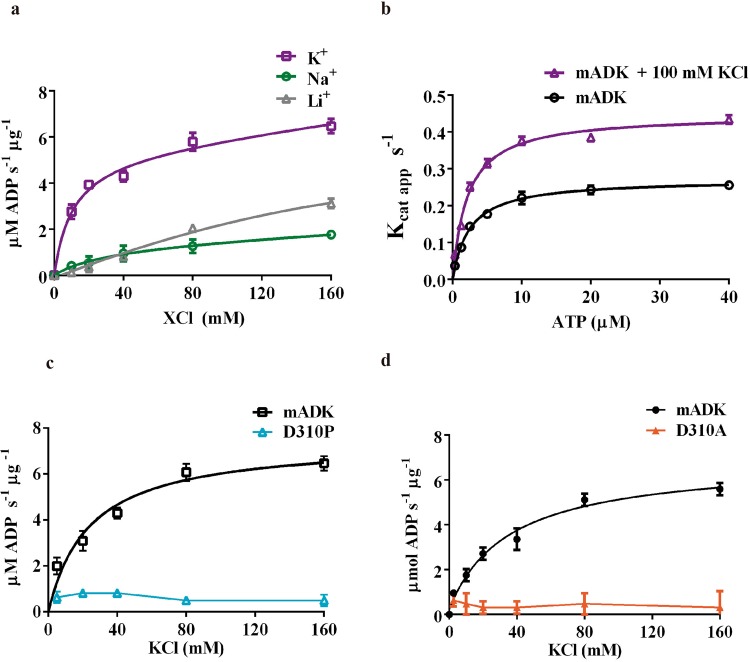
Figure 5.
Activation of mADK by K+. (a) mADK kinase activity in the presence of chloride salts (KCl, NaCl and LiCl). The initial rate of the reaction of mADK was measured varying chloride salts from 0 to 160 mM. The reaction conditions were, 15 nM mADK, 20 µM ATP and 10 µM ADO. Kd average value obtained was 10.4 ± 2.30 mM and was estimated by one site total equation fitting by Prism 6.1 software (R square of 0.988 (K+)). There was no coherent fit for sodium and lithium salts. (b) Kcat curves performance in the presence and absence of potassium. Initial rate of mADK reaction was measured in function of ATP in the presence (purple line) or absence (black line) of 100 mM potassium. Apparent Kcat values were obtained by the Vmax (µM ADP. s-1)/ [mADK](µM). Continuous line represents the Michaelis Menten model fitting. Kinetic constants are shown in the Supplementary Table 3. (c) Effect of the D310A and (d) D310P mutations in the activation of mADK by K+. Both mutants abolished the mADK activation by the K+ ion.

