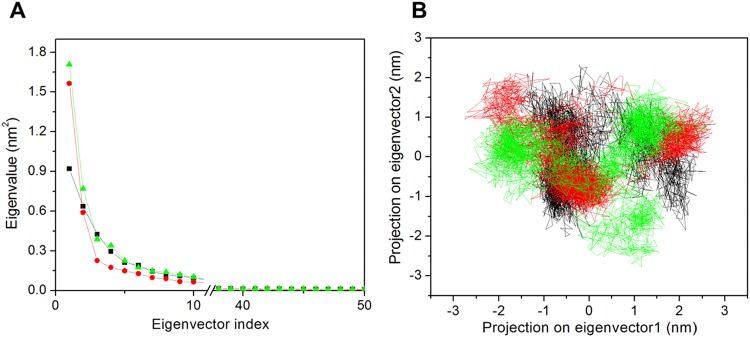
Figure 7.
Principal component analysis. (A) Plot of eigenvalues was plotted vs eigenvector index. First 50 eigenvectors were considered. NBD1 (black) and the ligands, NBD1-potassium citrate (red), NBD1-technetium Tc-99m medronate (cyan) indicate the eigenvalues. (B) Projection of the motion of the protein in phase space along the PC1 and PC2 for NBD1 (black) and the ligands NBD1-potassium citrate (red), NBD1-technetium Tc-99m medronate (cyan) at 300 K.

