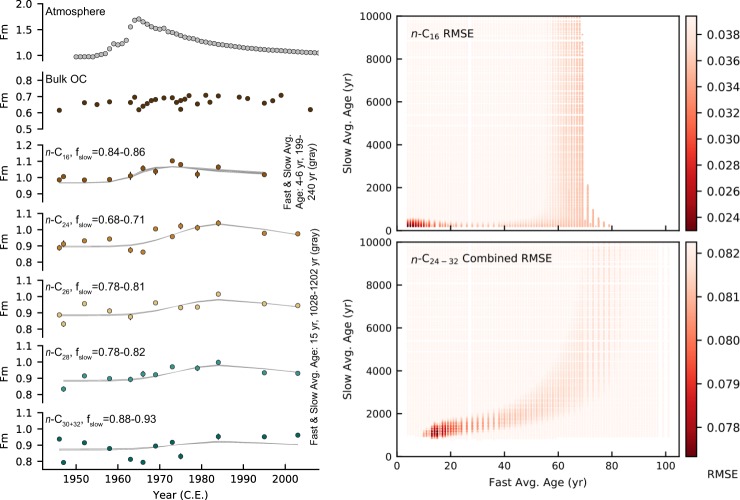
Figure 1.
Measured radiocarbon time series and fatty acid age structure modeling results. The measured 14C composition of bulk OC and fatty acids reported in Fm with 1σ error bars are plotted compared to the atmospheric radiocarbon composition in the northern hemisphere zone 326 (left). The heat maps (right) show how well each age structure fits the measured fatty acid Fm data according to RMSE. The color bars are scaled to bracket the RMSE values of the top 10% best-fitting age structures, where darker red represents better fits. Fast-cycling average ages exceeding 70–80 years are excluded for n-C16 because the optimal calculated fSlow is outside of the allowed range of 0 to 1. Note, that the modeling results shown for C24+ fatty acids are based on keeping the fast- and slow-cycling endmembers constant for all of the long-chain fatty acids. Synthetic Fm time series for the eight best-fitting age distributions are plotted in gray against the measured fatty acid Fm (left). The age distribution characteristics of the n-C16 and long-chain fatty acid synthetic Fm time series are described in the first and last rows of Table 1, respectively. See Figs. S9 and S10 for RMSE heat maps over the complete slow-cycling average age range (0–50,000 years) and additional synthetic Fm time series plots.

