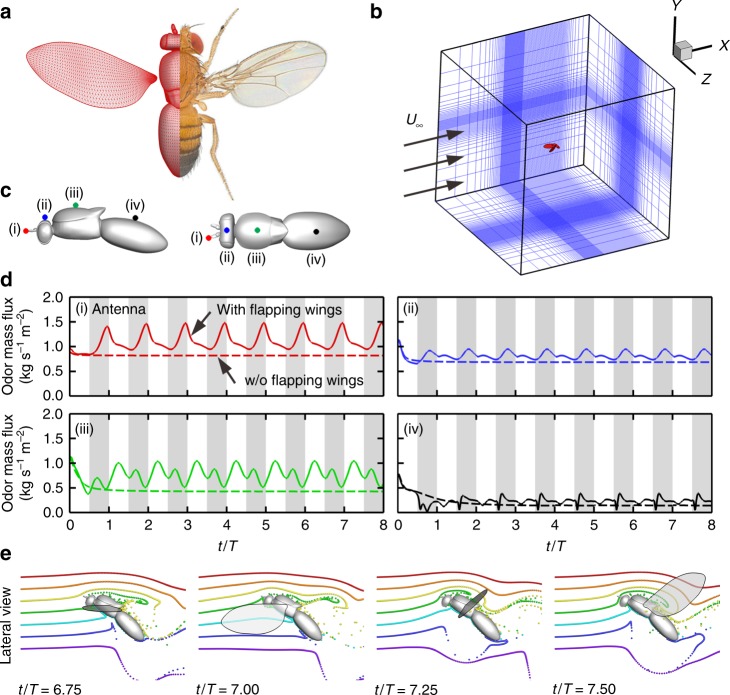
Fig. 1.
Modeling of fruit fly in forward flight. a The fruit fly D. melanogaster, with the computational model on the left half. High-density surface mesh with approximately 29,000 and 5000 triangular elements was used to define the body and each wing, respectively. The Drosophila image is credited to Tim Weil and Anna York-Andersen from Weil Lab at the University of Cambridge under creative common license. b Simulation setup is mimicking a fruit fly flying forward at a speed of 0.94 m/s and flapping frequency of 213 Hz (reduce frequency k = 0.65). The simulation has ~10 million computational grids. c The probe location for measuring the odor mass flux around fruit fly body. d The odor mass flux at the antenna (i) and different locations (ii–iv) around the fruit fly body (Fig. 1c). The shaded areas represent downstrokes. The dashed lines indicate the odor mass flux without wings flapping. The antenna is well positioned to receive significant increase of odor mass flux while avoiding significant turbulence compared to other locations along the body (see more in Supplementary Fig. 3). e Lateral view of odor particle tracers at various time points. The colors of the particles indicate different release locations. Left to right: middle downstroke (t/T = 6.75); supination (t/T = 7.00); middle upstroke (t/T = 7.25); pronation (t/T = 7.50). During the downstroke (t/T = 0.65–7.00), the flapping wing pushes and traps odorous air below the body, preventing it from escaping downstream. Once the wings start to reverse and flap upward (t/T = 7.25–7.50), the wide trailing edges close to the wing root rotate and flick the trapped odorous air upward toward the antennae. The peak odor mass flux at the antenna (Fig. 1d–i) occurs not during upstroke or downstroke but, rather, during this wing transition phase

