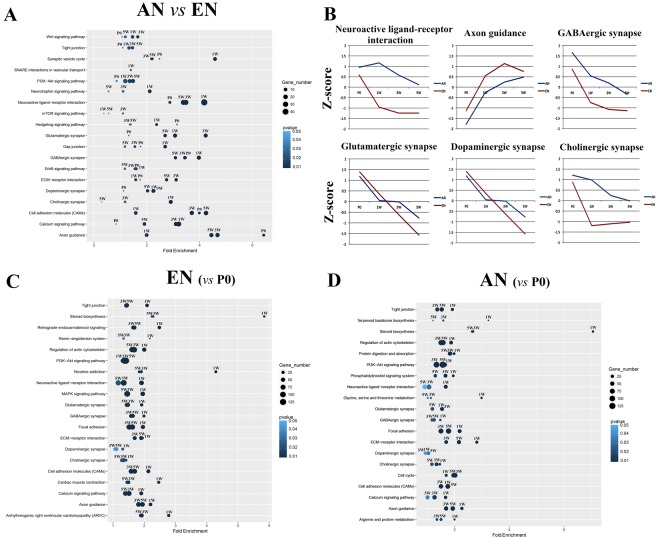
Figure 5.
Enriched KEGG pathways for the differentially expressed genes. Comparison of genes differentially expressed between efferent and afferent nerve fibres (A) in different developmental processes, and Z-scores for the six critical Kyoto Enrichment of Genes and Genomes (KEGG) pathways (B). The differentially expressed genes in efferent (C) and afferent (D) nerve fibres at postnatal developmental stages (1 week [1 W], 3 weeks [3 W], and 5 weeks [5 W]) were compared with those at postnatal day 0 (P0). The colour intensity of the dots represents the p value, and the size of the dots represents the ratio of differentially expressed genes in the specific KEGG pathway.

