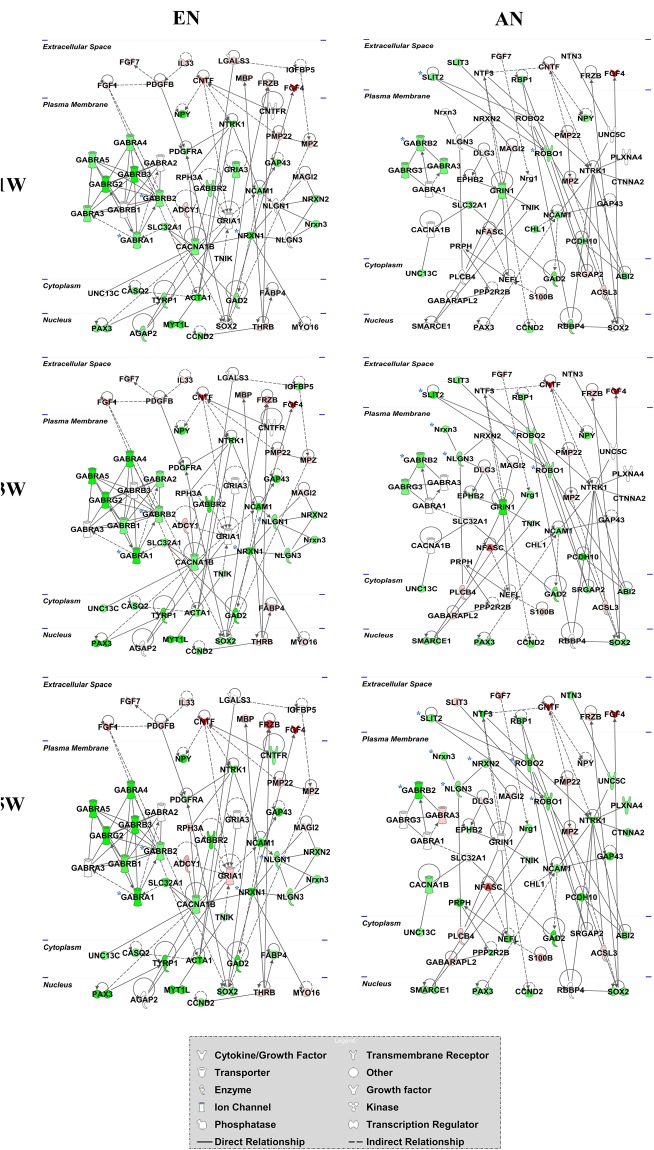
Figure 7.
Dynamic changes in differentially expressed genes associated with efferent and afferent nerve fibre development. The gene network diagrams show the interactions and correlations of differentially expressed genes during efferent and afferent nerve fibre development at different postnatal stages (1 week [1 W], 3 weeks [3 W], and 5 weeks [5 W], when compared with postnatal day 0 [P0]). Red colour indicates the fold change in up-regulation, while the green colour indicates the fold change in down-regulation. Colour intensity indicates the relative fold change values. The key genes are highlighted with blue asterisks.

