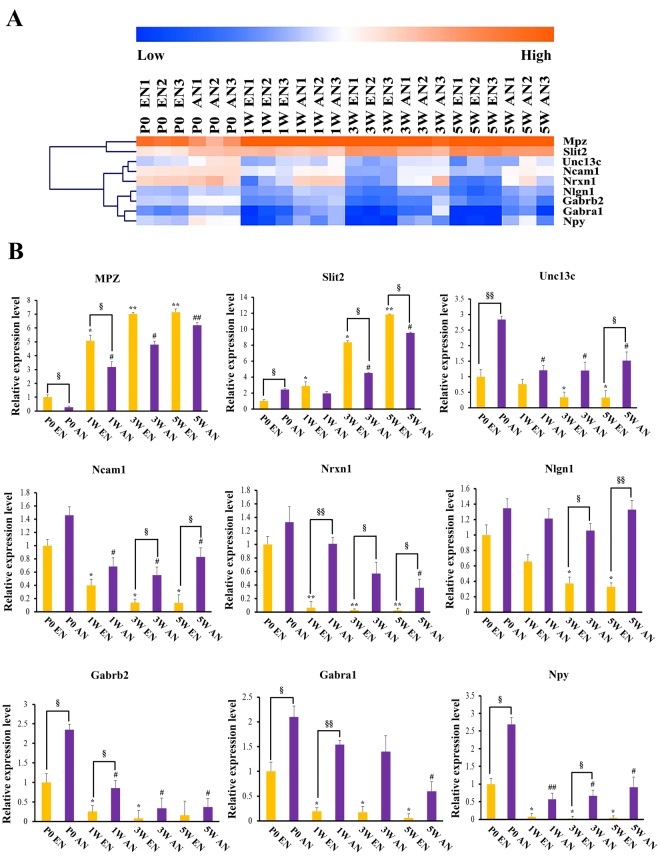
Figure 8.
Real-time quantitative polymerase chain reaction-based validation of key genes associated with efferent and afferent nerve fibre development. Heat map clustering displaying the relative mRNA expression levels of 9 differentially expressed genes selected from all 24 samples (8 groups in triplicate). The orange colour indicates the genes that are upregulated, and the blue colour indicates the genes that are downregulated. The values were calculated using comparative 2−ΔΔCt method, with Gapdh levels as the internal control (efferent nerve fibres are shown in yellow and afferent nerve fibres are shown in purple). Error bars represent standard deviations from the mean. Data were obtained in three independent experiments. *, #,§p < 0.05; **, ##, §§p < 0.01; *in efferent nerve fibre development, #in afferent nerve fibre development, §difference between efferent and afferent nerve fibre expression.

