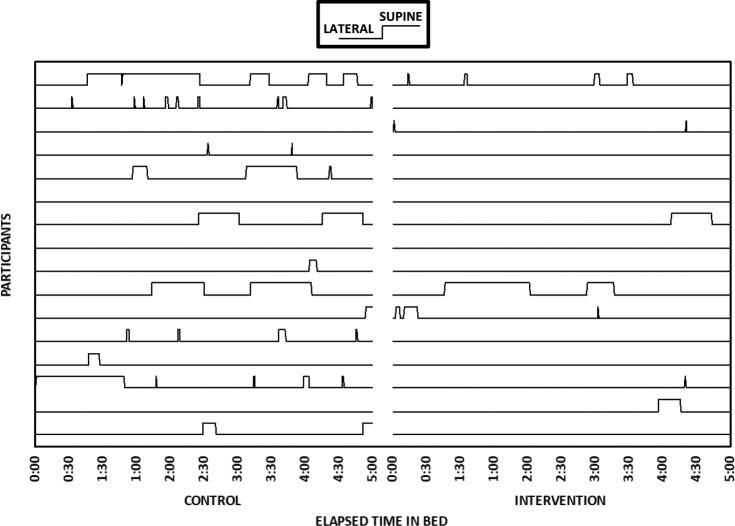
Figure 3. Sleep position for each participant (lines) on control (left) and intervention (right) nights by elapsed time in bed.
n = 16 participants are shown. These participants have complete video records for both nights. The first 5 hours are shown, because these participants were in bed for at least 5 hours on both nights.

