
Fig. 3.
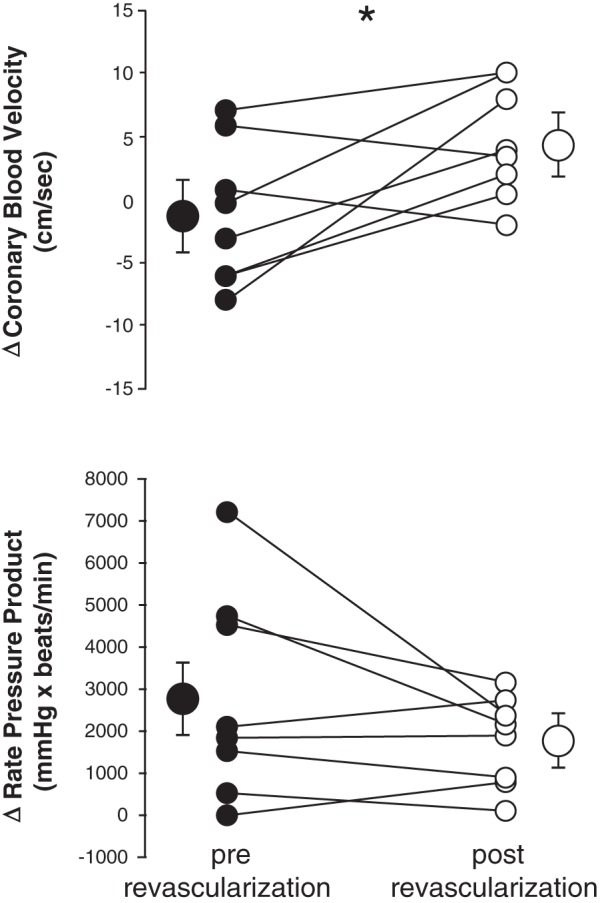
Coronary blood velocity and rate pressure product responses to single-leg plantar flexion exercise pre-revascularization (●) and 1 mo post-revascularization (○). Each circle represents the change from baseline to maximum exercise in one subject (n = 8). Values expressed as means ± SE are also shown on the outside of the individual data as larger circles with brackets. *P < 0.05 between treatments.