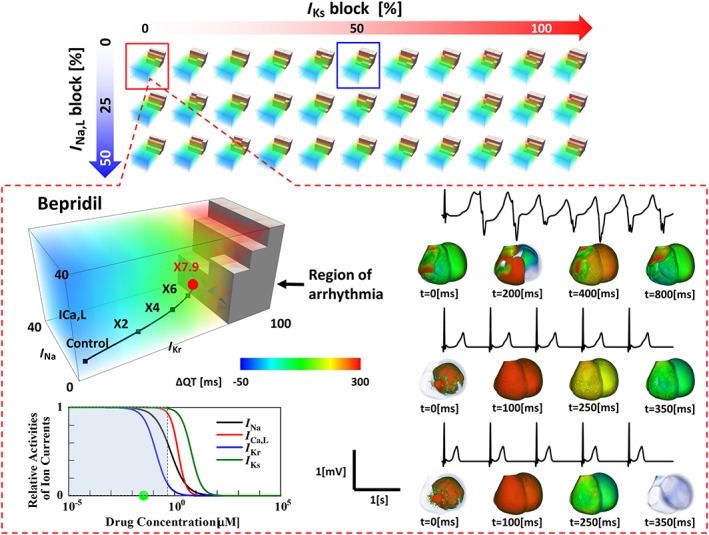
Figure 3.

Five‐dimensional hazard map of drug‐induced arrhythmias. Top: Five‐dimensional data are visualized as a cluster of three‐dimensional subspace distributed in a plane with axes of I Ks block and I Na,L block. The coordinate system of subspace consists of the extent of block of I Kr, I Na and I Ca,L. Bottom: In each subspace (in this case, I Ks block = 0% and I Na,L block = 0%), the dose‐dependent effect of the drug (bepridil) can be traced as a trajectory. The trajectories were generated by functions, and the numbers on them represent the drug concentrations expressed as multiples of ETPCunbound. The region of arrhythmia is indicated as brown blocks. The inset shows the concentration–block relations of five ion currents. It demonstrates that virtually no inhibitory effects were observed for I Ks or I Na,L in the concentration ranges studied (shaded area). ECG changes at various concentrations are shown to the right with the corresponding activation sequence in the heart.
