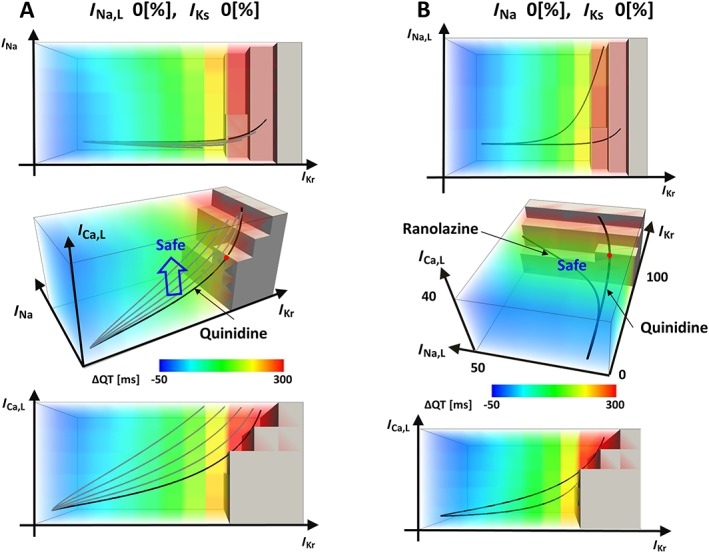
Figure 5.

Visualizations of drug effects in hazard map. In each panel, orthogonal projections are shown with a 3D hazard map. (A) Concentration–block relationships of quinidine in a subspace at I Na,L block = 0% and I Ks block = 0% are shown. From the original trajectory (thick line), the effect of I Ca,L block was added gradually to shift the trajectory (blue arrow). (B) The effect of I Na,L block was visualized for quinidine and ranolazine in a subspace with I Ca,L, I Kr and I Na,L coordinates (I Na block = 0% and I Ks block = 0%).
