Figure 6.

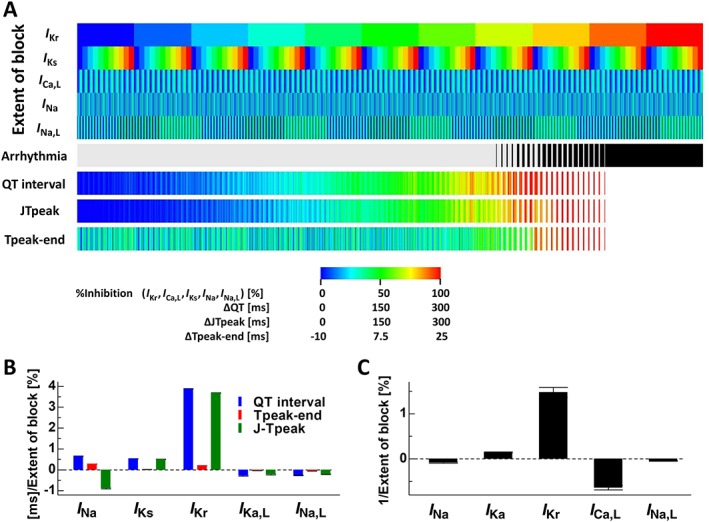
Effects of multiple ionic current blocks on arrhythmogenicity and ECG indices. (A) In the five rows at the top, the extent of block of I Kr, I Ks, I Ca,L, I Na and I Na,L is shown in colour. For each combination of ionic current block, the occurrence of arrhythmia is indicated in black (6th row). Prolongations of the QT interval (ΔQT, 7th row), J‐Tpeak (ΔJ‐Tpeak, 8th row) and Tpeak‐Tend (ΔTpeak‐Tend, 9th row) are shown in colour. Colour codes are summarized in the bottom legend. (B) Coefficients of linear regression applied to changes in QT interval, Tpeak‐Tend and J‐Tpeak. (C) Coefficients of logistic regression applied to the relationship between the occurrence of arrhythmia and ionic current block.
