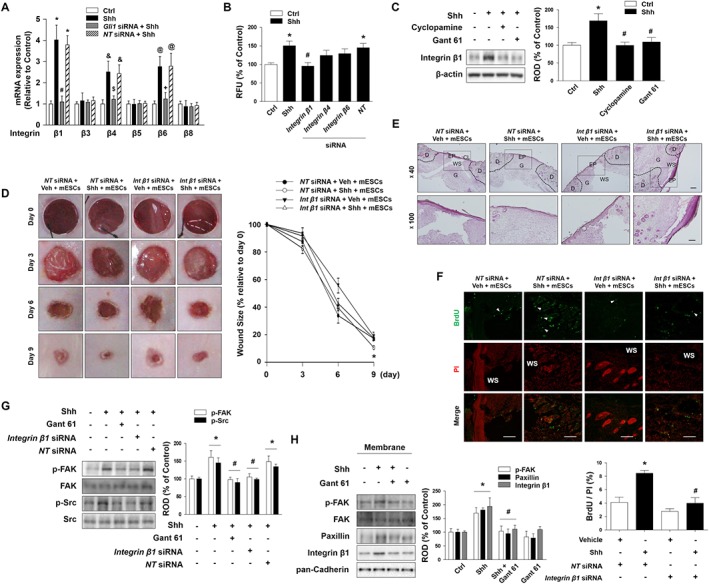
Figure 4.

The role of integrin β1 on mESC migration. (A) mESCs were transfected with Gli1 siRNA (20 nM) or NT siRNA for 24 h prior to Shh treatment for 24 h. The levels of integrins β1, β3, β4, β5, β6 and β8 mRNA expression were measured by real‐time PCR. The data are expressed as mean ± SEM for five experiments. *P < 0.05 versus control of integrin β1; # P < 0.05 versus Shh + NT siRNA of integrin β1; & P < 0.05 versus control of integrin β4; $ P < 0.05 versus Shh + NT siRNA of integrin β4; @ P < 0.05 versus control of integrin β6; + P < 0.05 versus Shh + NT siRNA of integrin β6. (B) mESCs were transfected with integrins β1, β4, β6 or NT siRNA for 24 h prior to Shh treatment for 24 h. Migration of Shh‐treated cells was quantified using the Oris™ migration assay kit. The data are reported as the mean ± SEM for five independent experiments. *P < 0.05 versus control; # P < 0.05 versus Shh + NT siRNA. (C) mESCs were pretreated with cyclopamine or Gant 61 prior to Shh treatment for 24 h, and integrin β1 was detected by Western blotting. The data are expressed as mean ± SEM for six independent experiments. *P < 0.05 versus control; # P < 0.05 versus Shh. (D) Mice were randomly divided into four groups (n = 6 each group): NT siRNA + Vehicle + mESCs, NT siRNA + Shh + mESCs, integrin β1 siRNA + Vehicle + mESCs, or integrin β1 siRNA + Shh + mESCs. Wounds (6 mm diameter) were created by using a biopsy punch. Representative gross images of wounds at days 0, 3, 6 and 9 are shown. (left panel) Wound sizes compared to original wound size at day 0 were quantified. (right panel) The values are reported as the mean ± SEM. n = 6. *P < 0.05 versus NT siRNA + Vehicle + mESC group. (E) Wound tissues were stained with H&E at day 9 after wounding. Scale bars = 200 μm or 100 μm, magnification; ×40 or ×100. (F) mESCs were pretreated with BrdU (2 μM) for 24 h prior to injection. Wound tissues were immunostained with BrdU (green) and PI (red) and then visualized by confocal microscopy (upper panel). Scale bar = 100 μm. The percentage of BrdU‐positive cells in total cells was analysed by using Metamorph software (lower panel). The data are expressed as mean ± SEM for six independent experiments. *P < 0.05 versus Veh + NT siRNA; # P < 0.05 versus Shh + NT siRNA. (G) mESCs were pretreated with Gant 61, integrin β1 siRNA or NT siRNA prior to Shh treatment for 1 h, and p‐FAK and p‐Src were detected by Western blotting. The data are expressed as mean ± SEM for five independent experiments. *P < 0.05 versus control; # P < 0.05 versus Shh + NT siRNA. (H) mESCs were pretreated with Gant 61 prior to Shh treatment and the expressions of p‐FAK, paxillin and integrin β1 in the membrane fraction were detected by western blotting. Pan‐cadherin was used as the membrane marker. The data are expressed as mean ± SEM for six independent experiments. *P < 0.05 versus control; # P < 0.05 versus Shh. CL, cornified layer; Ctrl, control; D, dermis; EP, epidermis; G, granulation tissue; NT, non‐targeting; RFU, relative fluorescence units; ROD, relative optical density; WS, wound site.
