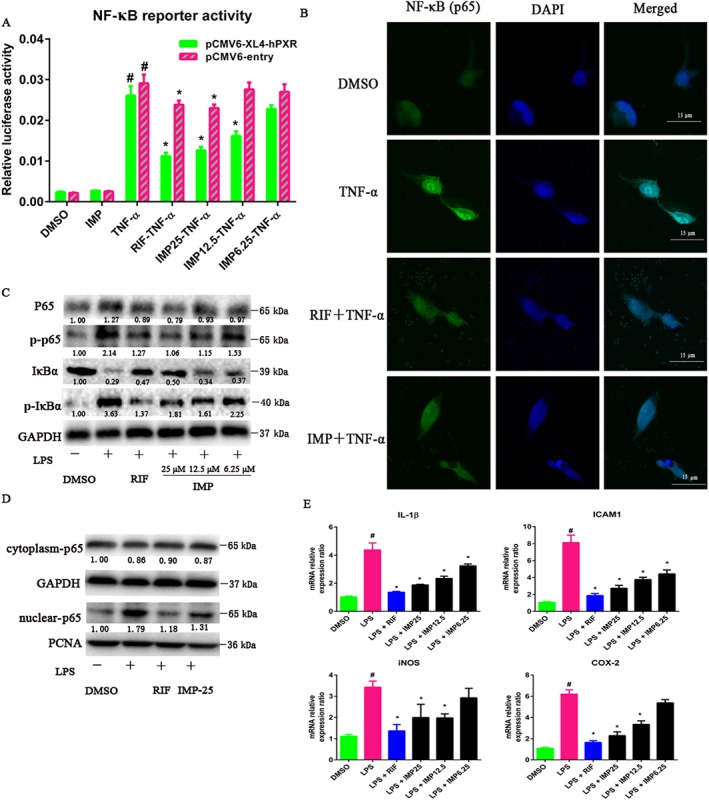
Figure 6.

IMP suppresses LPS‐induced NF‐κB activity and down‐regulates NF‐κB‐mediated pro‐inflammatory gene expression in LS174T cells. (A) HEK293T cells were transiently transfected with pGCL4.32 (luc2P/NF‐κB‐RE/Hygro) NF‐κB reporter, pCMV6‐entry or pCMV6‐XL4‐hPXR, and pRL‐TK. After transfection overnight, cells were treated with DMSO, IMP (6.25–25 μM) or rifampicin (RIF; 10 μM) for 24 h, followed by additional incubation with or without TNF‐α (20 ng·mL−1) for another 24 h. A standard dual luciferase assay was performed on the cell lysates. Results are expressed as fold changes compared with the DMSO control. Data are expressed as mean ± SEM from five independent experiments. # P < 0.05 compared with the TNF‐α group with or without hPXR. * P < 0.05 compared with the same treatment group transfected with empty vector and the TNF‐α group transfected with the receptor expression plasmid. (B) LS174T cells were treated with DMSO, IMP (25 μM) or rifampicin (10 μM) for 48 h, followed by additional incubation with or without TNF‐α (20 ng·mL−1) for 24 h. NF‐κB p65 localization was performed using immunofluorescence staining and observed under a confocal laser scanning microscope (magnification: 630×) using an anti‐NF‐κB p65 antibody (1:50) followed by an Alexa Fluor 488‐conjugated detection antibody. (C) NF‐κB p65, phospho‐p65 (p‐p65), IκBα and phospho‐IκBα (p‐IκBα) protein levels in LS174T cells were determined by Western blotting. The numbers at the bottom indicate the relative intensity of the protein bands, with the DMSO‐treated sample set as ‘1.00’. (D) NF‐κB p65 protein levels in the cytoplasm and nucleus of LS174T cells were determined by Western blotting. GAPDH and PCNA were used as cytoplasm and nuclear markers respectively. The numbers at the bottom indicate the relative intensity of the protein bands, with the DMSO‐treated sample set as ‘1.00’. (E) The mRNA levels of IL‐1β, ICAM1, iNOS and COX‐2 were determined using qRT‐PCR. LS174T cells were treated with DMSO, IMP (6.25–25 μM) or rifampicin (10 μM) for 48 h, followed by additional exposure to LPS (2000 ng·mL−1) for 24 h. Results are expressed as fold changes compared with the DMSO control. Data are expressed as mean ± SEM from five independent experiments. # P < 0.05 compared with the DMSO control group. * P < 0.05 compared with the LPS control group.
