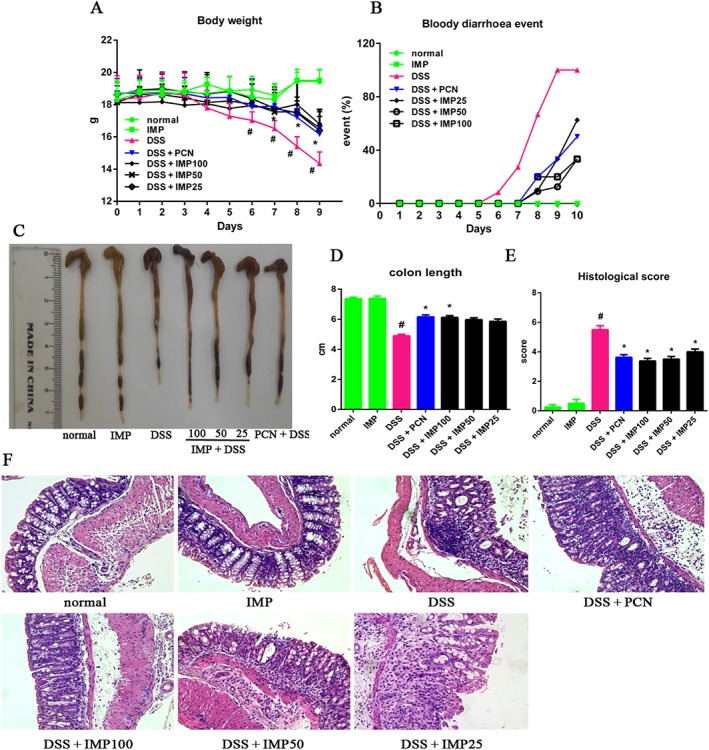
Figure 8.

IMP ameliorated DSS‐induced colitis in mice. (A) Body weight changes after the onset of DSS‐induced colitis. (B) Mice were evaluated for the occurrence of bloody diarrhoea after DSS exposure. Data are expressed as the percentage of total mice at different time points during DSS exposure. (C) Macroscopic observation of colon shortening. (D) Colon length. (E) Histological score for H&E‐stained colon sections. (F) Representative H&E‐stained colon sections (magnification: 200×). Data are expressed as mean ± SEM for each group of mice (n = 8). # P < 0.05 compared with the normal group. * P < 0.05 compared with the DSS group.
