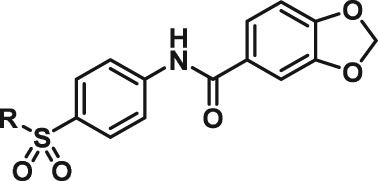
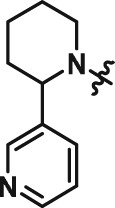
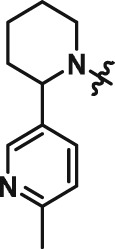
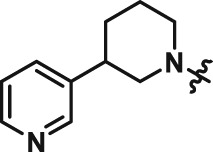
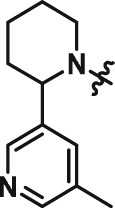
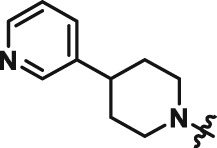
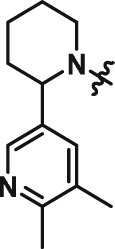
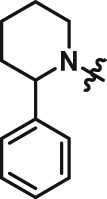
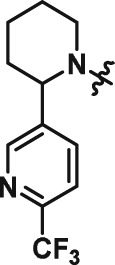
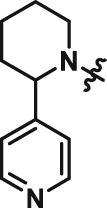
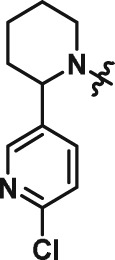
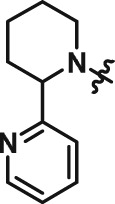
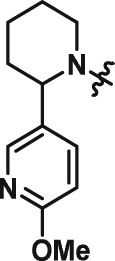
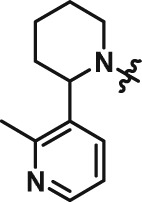
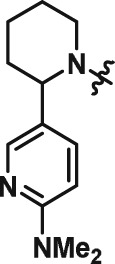
Table 1.
SAR of ATV399 led to compounds with increased potency
|
| |||||||
|---|---|---|---|---|---|---|---|
| Entry | Compound | Structure | EC50 (μM) | Entry | Compound | Structure | EC50 (μM) |
| 1 | ATV399 |
|
2.90 | 8 | CAT639 |
|
0.48 |
| 2 | CAT628 |
|
>20 | 9 | CAT636 |
|
3.10 |
| 3 | CAT640 |
|
>20 | 10 | CBD498 |
|
1.2 |
| 4 | CAT635 |
|
8.75 | 11 | CBD504 |
|
0.098 |
| 5 | CAT648 |
|
9.54 | 12 | CBD505 |
|
0.12 |
| 6 | CAT646 |
|
>20 | 13 | CBD501 |
|
0.91 |
| 7 | CAT634 |
|
>20 | 14 | CBE173 |
|
8.8 |
Rat insulin‐producing INS1E cells were pretreated with compounds at different doses (n = 6) for 24 h, followed by co‐treatment with pro‐inflammatory cytokines (10 ng·mL−1 IL‐1β and 100 ng·mL−1 IFNγ) for an additional 24 h. Then cleaved caspase‐9 levels were determined using caspase‐9 Glo, and the luminescence signal evolved was read and used to calculate EC50 values.

