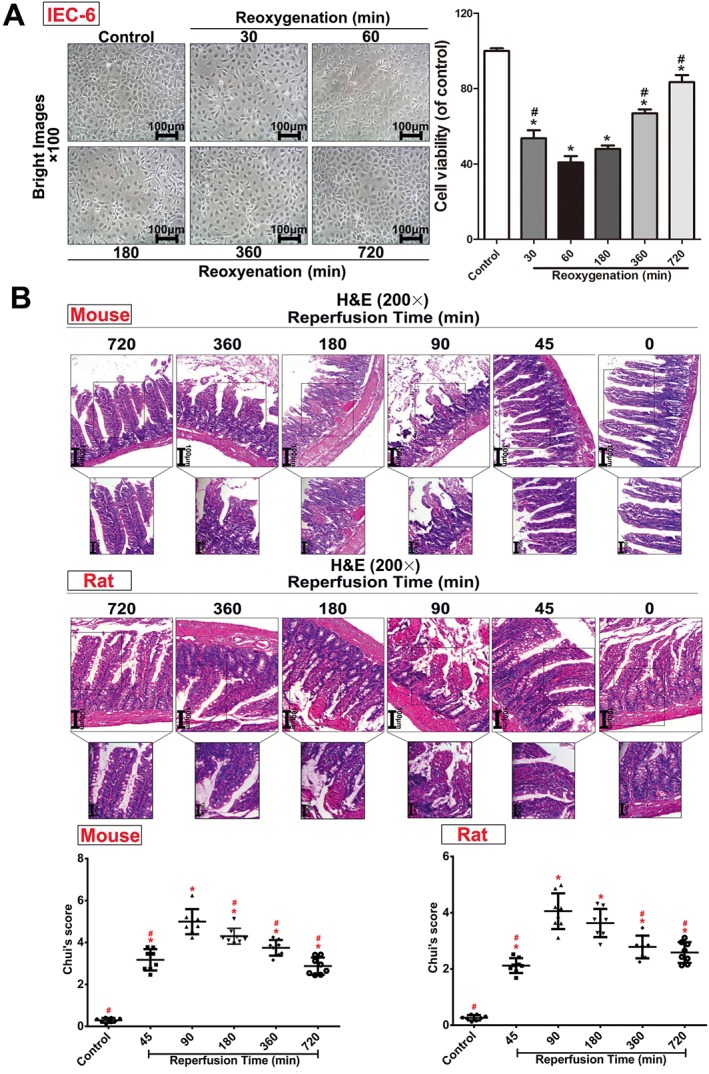
Figure 1.

H/R injury in IEC‐6 cells and II/R injury in rats and mice. (A) Cellular morphology and cell viabilities of IEC‐6 cells after H/R injury (n = 5). (B) II/R injury in rats and mice assessed by H&E staining (200× magnification) and Chui's score (n = 8). All data are expressed as the mean ± SD. * P < 0.05, significantly different from control group; # P < 0.05, significantly different from the 60 min reoxygenation or 90 min reperfusion group.
