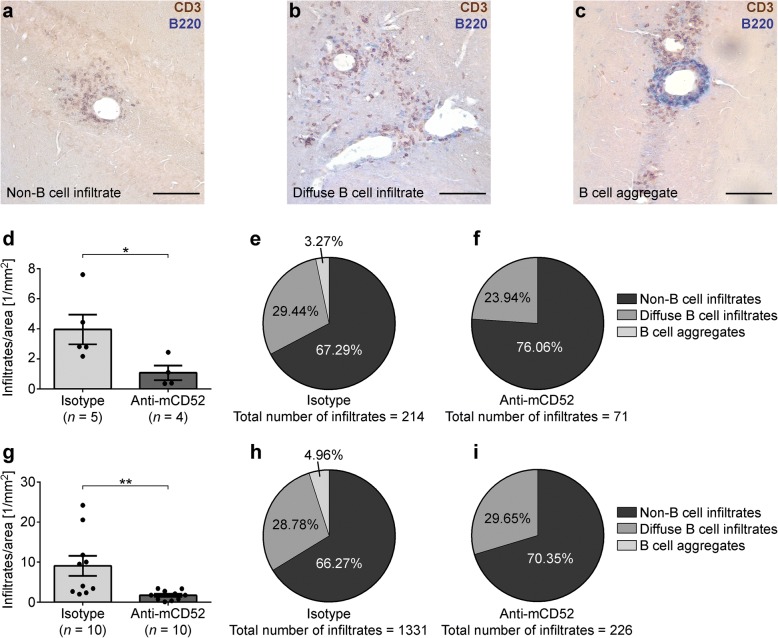
Fig. 3.
Histological analysis of B cell aggregates in the cerebella of MP4-immunized mice. a–c CD3/B220 double staining of representative cerebellar sections of a mouse treated with isotype control at the peak of disease. The panels demonstrate the different infiltrate categories. Scale bars represent 100 μm. d–f Quantification of the number of infiltrates per parenchymal area and distribution of infiltrate categories in mice treated either with anti-mCD52 antibody or isotype control at the peak of disease. g–i Quantification of the number of infiltrates per parenchymal area and distribution of infiltrate categories in mice treated ~ 60 days after disease onset. Graphs show means ± SEM. *p < 0.05, **p < 0.01, Mann-Whitney test

