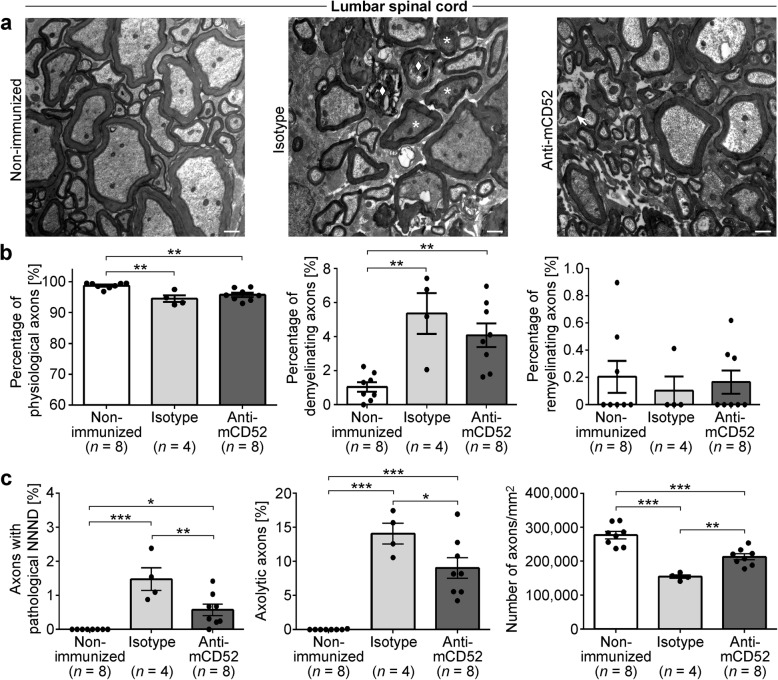
Fig. 6.
Electron microscopic analysis of demyelination and axonal damage in the spinal cord of MP4-immunized mice. a–c Representative electron microscopic images of the spinal cord of non-immunized control and in MP4-immunized mice that had received treatment with either isotype control or anti-mCD52 antibody ~ 60 days after EAE onset. Scale bars denote 1 μm. The arrow indicates a demyelinating axon. The asterisks represent axons with a decreased NNND, and the diamond shows an axolytic axon. b Quantification of the percentage of physiological and of de- and remyelinating nerve fibers in non-immunized control vs. MP4-immunized mice of the two treatment cohorts. c Quantification of axonal damage and loss in non-immunized control vs. MP4-immunized mice of the two treatment cohorts. Graphs show means ± SEM. *p < 0.05, **p < 0.01, ***p < 0.001, ANOVA

