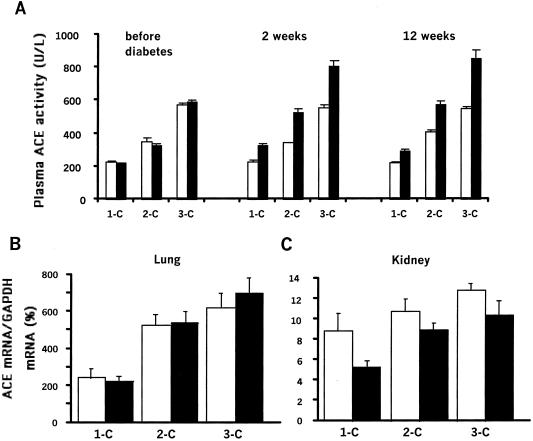
Figure 1.
Plasma ACE level and ACE mRNA in control (□) and diabetic (■) mice having one (1-C), two (2-C), or three (3-C) copies of the ACE gene. (A) Plasma ACE activity was measured before diabetes induction and at 2 and 12 weeks. Results are means ± SEM. Effect of genotype or diabetes, P < 0.001; interaction between genotype and diabetes, P < 0.001. (B and C) ACE mRNA levels were measured in the lung and kidney at 12 weeks. Results are normalized to glyceraldehyde-3-phosphate dehydrogenase (GAPDH) mRNA level. (B) Lung. Effect of genotype, P < 0.0001; effect of diabetes, P = 0.6. (C) Kidney. Effect of genotype or diabetes, P < 0.01.

