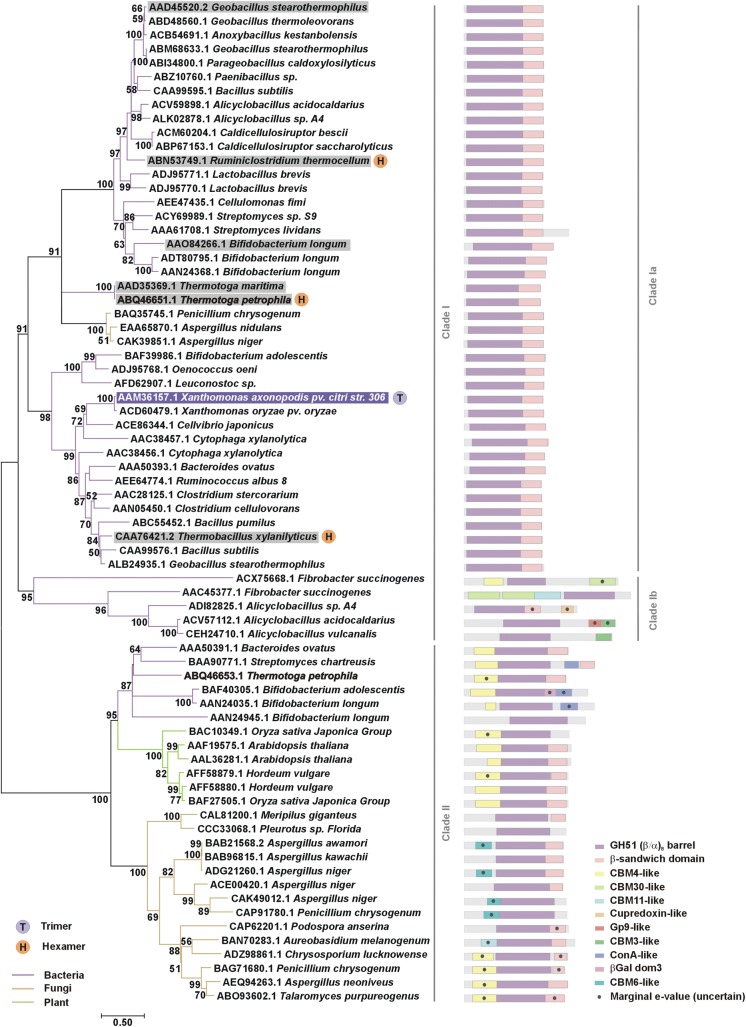
Fig. 8.
Molecular phylogenetic analysis of GH51 family. Phylogenetic tree (unrooted) based on a multiple sequence alignment of the (β/α)8 barrel of characterized GH51 enzymes present in the CAZY database [7] and the respective paralogues. The evolutionary history was inferred using the maximum likelihood method implemented in the MEGA7 software [65, 67]. The tree with the highest log likelihood (− 23,649.75) is shown and the percentage of trees in which the associated taxa clustered together are shown next to the branches (except for those with values below 50%). Branch lengths represent the number of substitutions per site. The right panel shows the domain architecture predicted for each sequence using the webserver SUPERFAMILY [63]. Proteins with known 3D structure are highlighted with purple (XacAbf51) or gray boxes. Paralogous sequences from T. petrophila are shown in bold

