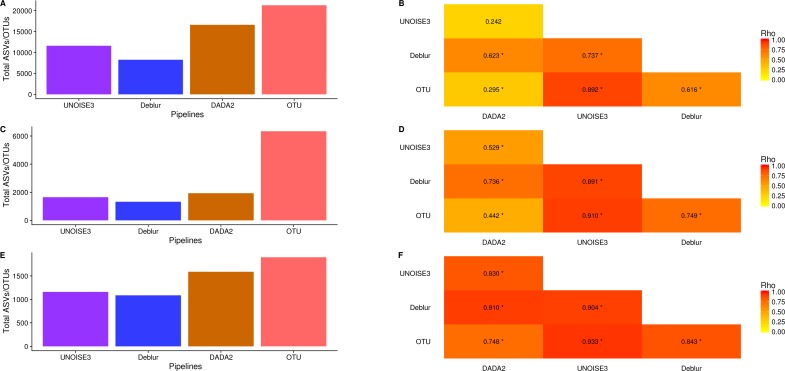
Figure 4. Total number of ASVs/OTUs called by each processing method and the per-sample observed ASV/OTUs correlation between each sequence processing method.
(A, C, E) The total numbers of ASVs/OTUs determined by each method on the soil, exercise, and human associated datasets, respectively. (B, D, F) Heatmaps of the Spearman correlations between the numbers of observed ASVs/OTUs per sample between different sequence processing methods. Significant p-values (p < 0.05) are indicated by *.

