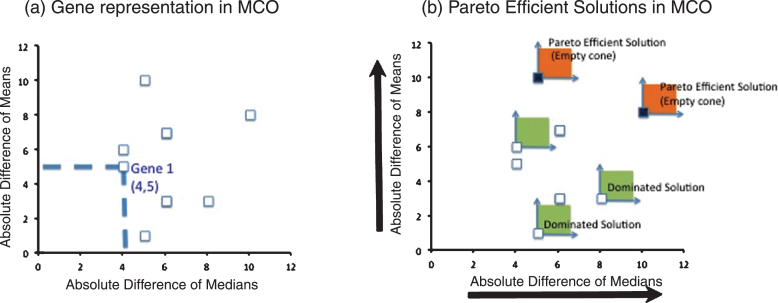
Fig.1.
(a) MCO representation: Each gene under analysis is represented by two performance measures to be maximized, in this case, the absolute difference of medians and the absolute difference of means (b) MCO Solution: the maximization directions help to form a cone that originates on a particular gene to be evaluated. If this cone is empty (it does not contain another gene), then the gene is a Pareto Efficient solution. Otherwise, the gene is a dominated solution and therefore not Pareto Efficient.

