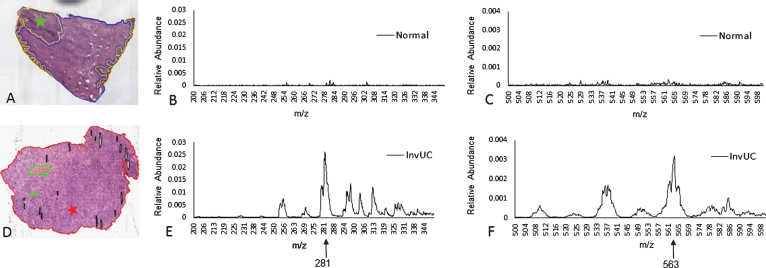
Fig. 1.
Mass spectra, TS-MS m/z ranges 200–350 and 500–600. The spectra from normal bladder (A) are represented in panels B (m/z range 200–350) and C (m/z range 500–600). The location within the section where the MS sample was collected is marked with the green star (A). The spectra from InvUC (D) are represented in panels E (m/z range 200–350) and F (m/z range 500–600). The location within the section where the sample was collected is marked with the red star (D). The abundance of m/z 281.5 and m/z 563.5 is much greater in InvUC compared to normal urothelium. Note that the scale for peak abundance (Y axis) in panels B and E (m/z range 200–350) differs from the scale in panels C and F (m/z range 500–600). The narrower scale in panels C and F allows the difference in m/z 563.5 between normal urothelium (C) and InvUC (F) to be visualized. The difference in abundance is relative to the TIC normalized values.

