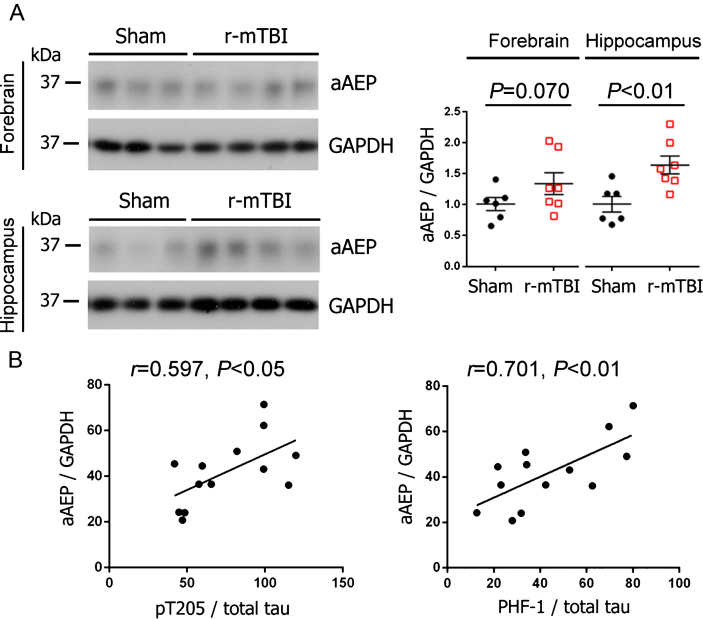
Fig. 3.
Activation of AEP is increased in the brain and correlated with the level of hyperphosphorylated tau following r-mTBI in 3xTg-AD mice. A) Representative western blots and quantification showing the level of active AEP (aAEP). Data are expressed as scattered dot plots with mean±SEM (n = 6-7 mice/group) and analyzed with unpaired Student t test. B) Pearson correlation of aAEP level to the level of indicated phospho-tau in the hippocampus.

