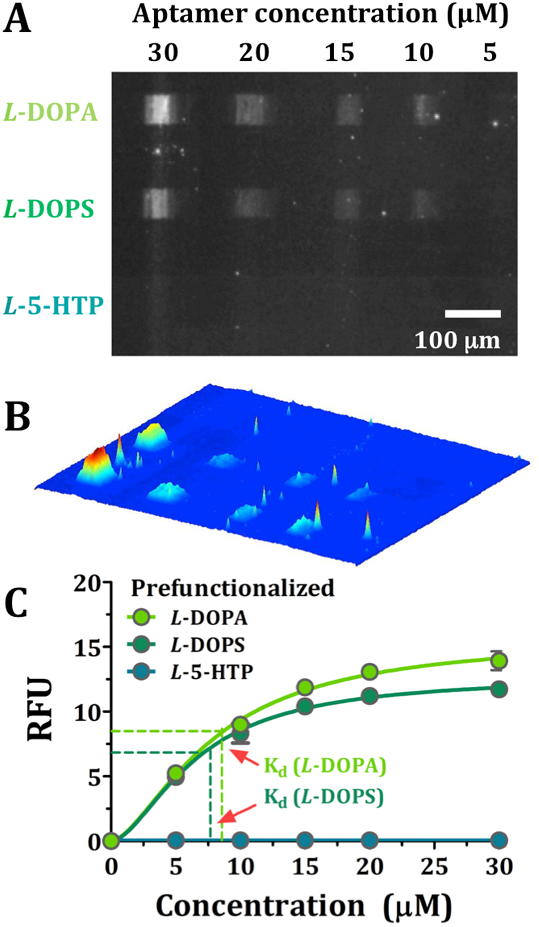
Figure 5.

(A) Representative fluorescence image at an emission wavelength of 605 nm for AlexaFluor® 546 (excitation at 556 nm) to visualize different concentrations of dopamine aptamer binding to each of three pre-functionalized thiols (i.e., L-DOPA, L-DOPS, and L-5-HTP). (B) A false-colored perspective plot of the fluorescence image shown in (A). In (C), on-substrate binding affinities were obtained simultaneously for all three targets by plotting fluorescence intensities at increasing aptamer concentrations. Error bars represent standard errors of the means for N=4 substrates and are too small to be visualized in most cases.
