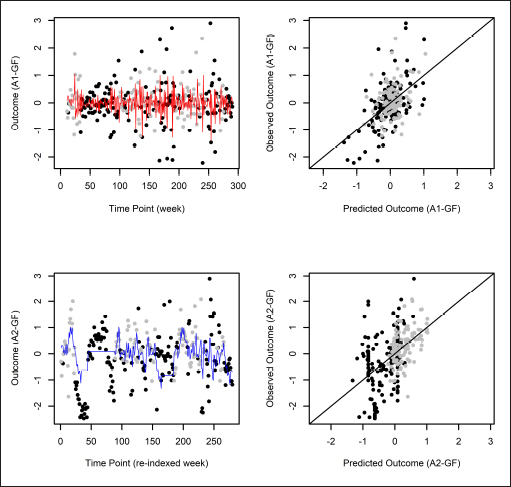
Fig. 2.

Analysis outcomes: Observed and predicted outcomes using the g-formula, for start day 3 at stability point k 0 = 11. (In each graph, high and low physical-activity analysis outcomes are plotted as black and gray circles, respectively. In the left column, the red and blue lines indicate predicted values for Analyses 1 and 2, respectively. In the right column, observed versus predicted analysis outcomes are plotted.)
