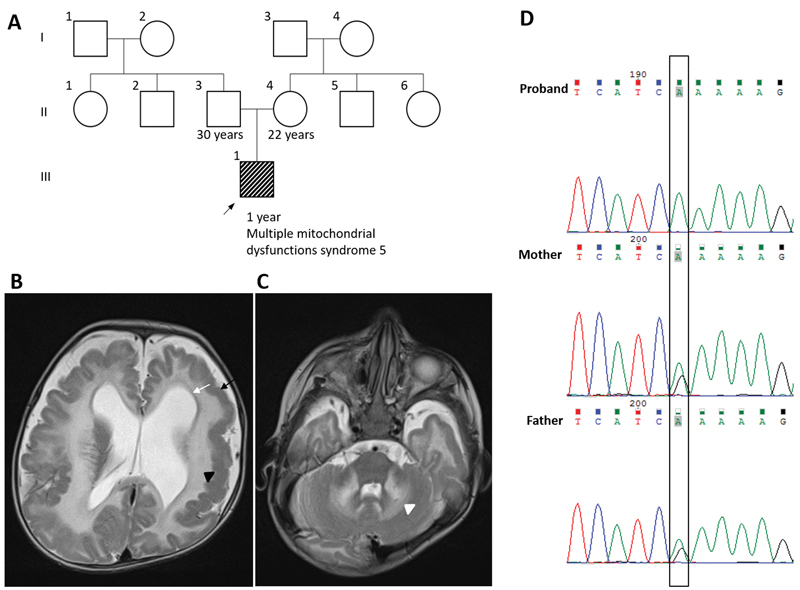
Fig. 1.

( A ) Pedigree of the family. ( B ) T2-weighted magnetic resonance imaging of brain shows pachygyria (black arrow), dilated ventricles (white arrow), and extensive hyperintensities in cerebral deep white matter (black arrowhead). ( C ) Extensive hyperintensities were also seen in deep cerebellar nuclei (white arrowhead) on T2-weighted magnetic resonance imaging of brain. ( D ) Homozygous variant c.259G > A [p. (Glu87Lys)] was observed on targeted Sanger sequencing in patient index, parents were heterozygous carriers.
