
Figure 5. The mPBPK model’s simulation of APA memory response is similar to clinical data for the clearance of pegloticase.
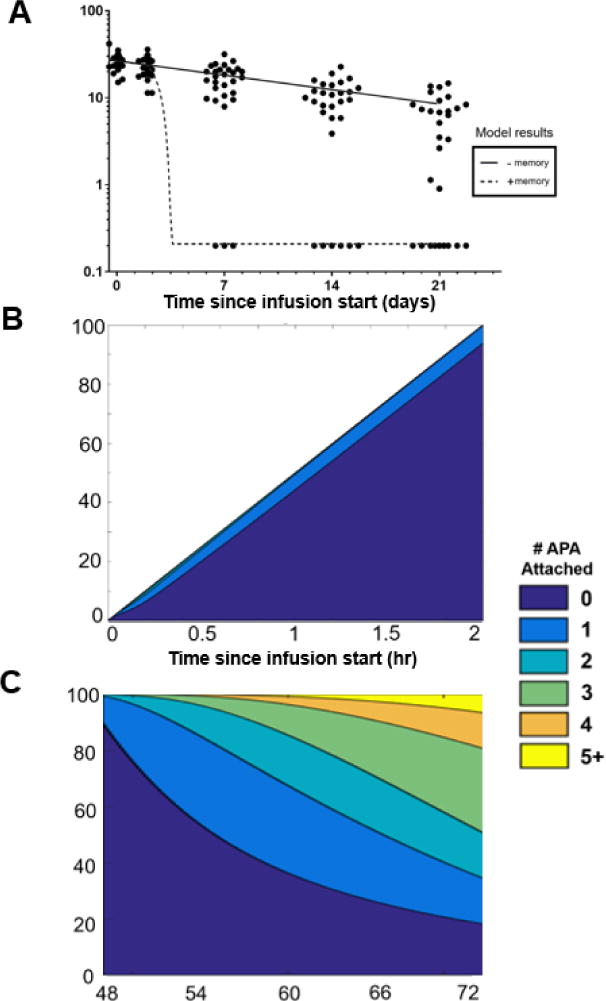
A) mPBPK model predictions of simulated patients with and without a memory APA response, overlaid with the clinical data adapted from [17]. Black circles represent individual patients’ measured pegloticase activity levels over time. All patients assumed to have 0.05μg/mL pre-existing APA. B) and (C): The predicted number of APA bound per pegloticase molecule in a simulated patient from the “+ memory” group shown in panel A over the course of (B) a 2-hour intravenous drug infusion of pegloticase or (C) between days 2 and 3 following administration. Further APA production was simulated to begin on day 2 and continue through the end of the simulation.