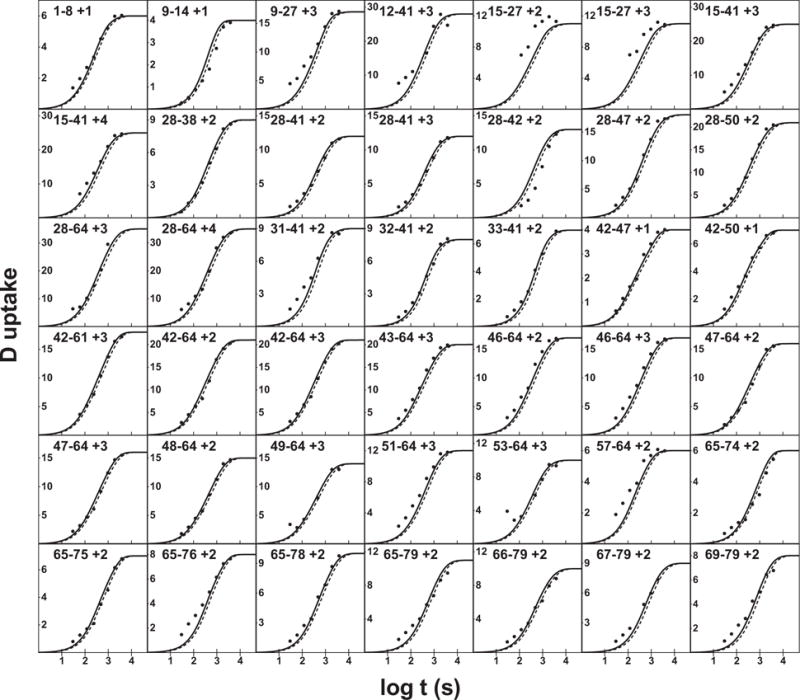
Figure 2.

Exchange curves for peptides obtained by HX MS for unstructured apolipoprotein C3 (90% D2O, pDread 4.10, 5°C). Samples were analyzed as for PDLA in Fig. 1 with the addition of an online pepsin digest. Peptides are identified by their sequence position in apoC3 and charge state in the MS. The expected free peptide exchange curves calculated with the original Bai et al. & Connelly et al. (9, 10) parameters are shown as a dashed line. The solid line uses the newly recommended value for the reference alanine rate (Table 1) and side chain effects described here (Table 2).
