
Fig. 4.
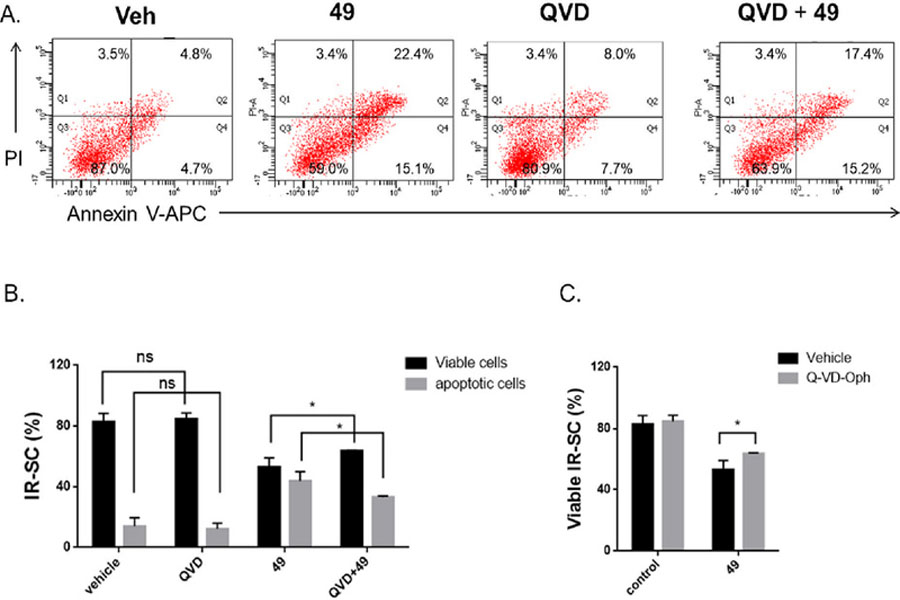
Compound 49 induced apoptosis in IR-induced WI-38 senescent cells (IR-SCs): (A) representative flow cytometric plots to measure apoptotic WI‐38 IR‐SCs at 48 h after treatment with vehicle (Veh), 49 (1 µM), Q-VD-Oph (QVD) (10 µM), or the combination of 49 (1 µM) and QVD (10 µM); (B) quantification of the percentage of viable and apoptotic WI-38 IR-SCs after 48 h treatment with vehicle, QVD (10 µM), 49 (1 µM), or the combination of 49 (1 µM) and QVD (10 µM); (C) quantification of the percentage of viable WI-38 IR-SCs 72 h after treatment with vehicle with or without QVD (10 µM) or with 49 (1 µM) with or without QVD (10 µM). Data in bar graphs are presented as mean ± SD, n = 3, *p < 0.05 indicates significant difference.