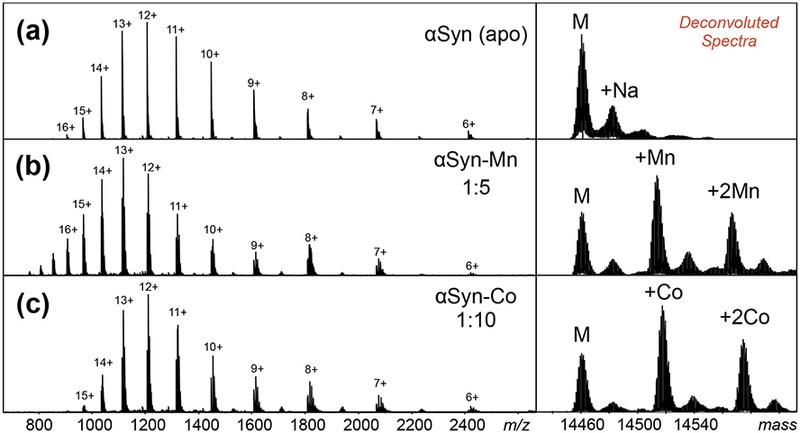
Figure 2.

ESI-MS spectra of (a) apo-αSyn, (b) αSyn-Mn complex, and (c) αSyn-Co complex. Deconvoluted spectra were generated by Bruker DataAnalysis software using maximum entropy (MaxEnt) (right panels). Concentration ratios of αSyn:metal were optimized at 1:5 and 1:10 for manganese and cobalt, respectively.
