Figure 5.

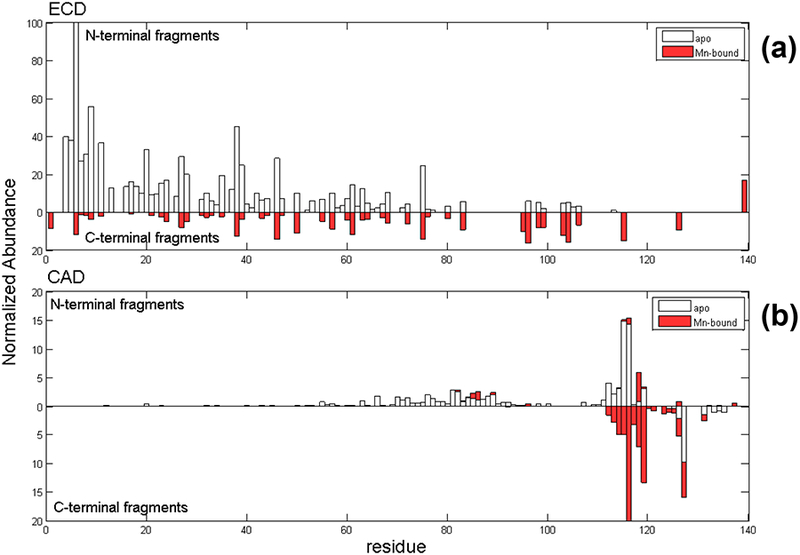
Native top-down MS fragmentation maps from (a) ECD and (b) CAD of αSyn-Mn complex. Holo-products are represented in red and apo-fragments are shown as hollow bars.

Native top-down MS fragmentation maps from (a) ECD and (b) CAD of αSyn-Mn complex. Holo-products are represented in red and apo-fragments are shown as hollow bars.