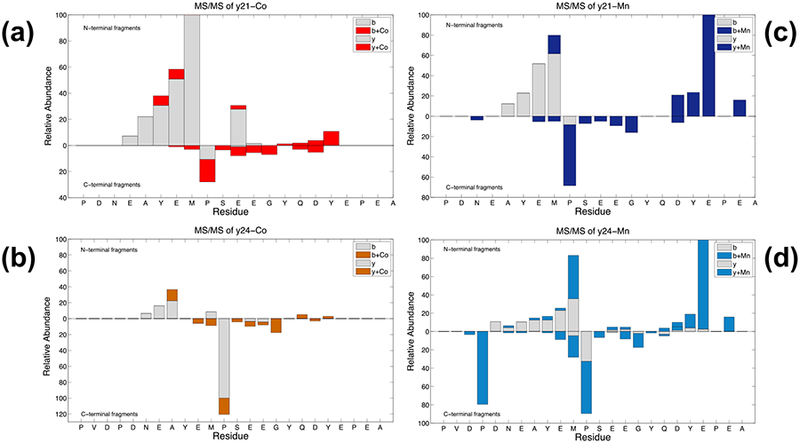
Figure 6.

Pseudo-MS3 fragmentation maps of αSyn-Co and αSyn-Mn complexes. For cobalt-binding, (a) y21+Co and (b) y24+Co were isolated for further CAD. For Mn-binding, (c) y21+Mn and (d) y24+Mn were isolated and further underwent CAD.

Pseudo-MS3 fragmentation maps of αSyn-Co and αSyn-Mn complexes. For cobalt-binding, (a) y21+Co and (b) y24+Co were isolated for further CAD. For Mn-binding, (c) y21+Mn and (d) y24+Mn were isolated and further underwent CAD.