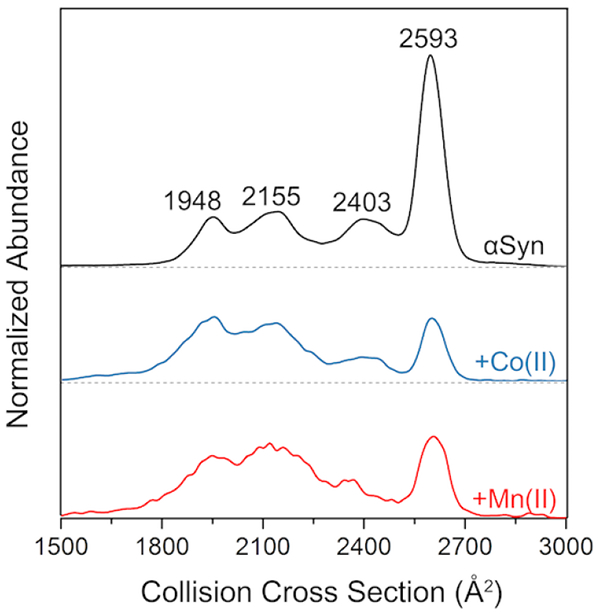
Figure 7.

IM-MS spectra of 9+ charged ions of αSyn (apo), αSyn-Co, and αSyn-Mn. Distributions were normalized to the total area in order to reflect the difference of the proportion of the conformations. (Portions of this figure were adapted from reference [81] with permission from the publisher.)
