Figure 1.

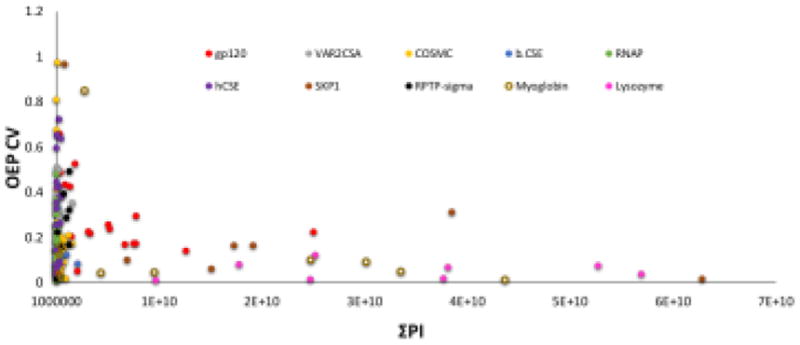
OEP CV versus the ΣPI of 180 oxidized peptides from ten model proteins. As the signal intensity of a peptide gets smaller, the variability in the amount of oxidation measured from triplicate samples increases.

OEP CV versus the ΣPI of 180 oxidized peptides from ten model proteins. As the signal intensity of a peptide gets smaller, the variability in the amount of oxidation measured from triplicate samples increases.