
Figure 5.
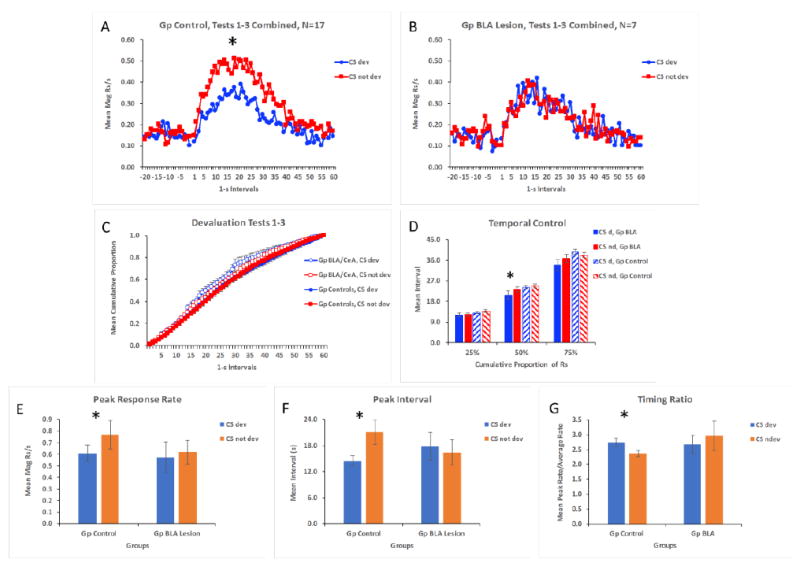
Mean magazine responses per s during devaluation test sessions in Experiment 2 across 1-s intervals (both pre stimulus and during the stimulus) in the presence of the conditioned stimuli (CS) paired with the devalued or not devalued rewards for Groups Control (A) and BLA Lesion (B). Mean cumulative proporation of responding across the trial is shown for the two groups (C), and the interval in which 25%, 50%, and 75% of total responses were produced are displayed for the groups (D). Panels E and F and G show peak rate, peak interval, and the peak rate/average rate (Timing Ratio), respectively, in the presence of the two stimuli for the groups. * indicates p < 0.05.